Instrumentation Issues and Problems in Earth Dams(Case Study; Shah Qasim Dam in Yasouj, Iran)- Juniper Publishers
Civil Engineering Research Journal- Juniper Publishers
Introduction
The importance of monitoring programs for dam safety is widely accepted. A well designed and executed instrumentation monitoring program can provide information that is needed for a solid understanding of the ongoing performance of a dam and may help detect early warning signs of trouble, [1]. Monitoring programs, including instrumentation and visual inspection, result in better estimation of probability of failure for dam owners. Furthermore, prediction of maintenance cost and rehabilitation time of the dam would be an easy issue using instrumentation. Many researchers and scientists have been interested in assessment of performance of various types of dams by analyzing and processing reliable data prepared by inserted instruments and modern monitoring settlements. Dam safety monitoring program for earthen dams has been considered by the National Hydrologic Warning Council in November 11, 2013. Modes of dam failure and monitoring and measuring techniques were investigated under the supervision of environment agency of England (Almog, E, 2011). A comprehensive research with the title [2]; Evaluating and Maintaining Piezometers, Relief Wells, and Drains were performed by Charles N. Easton et al for Association of State Dam Safety Officials, Inc (2016). There are a practical project about instrumentation of large dams which is issued by the ministry of water resources of india (2017). Well-planned and implemented monitoring is an essential component of successful dam construction and operation. Dam monitoring is subject to numerous regulations [3] and in many countries it is regulated by strict administrative standards (SMARTEC SA, 2017). Masoumi et al, considered reliable monitoring of embankment dams with optimal selection of geotechnical instruments (2017). Behaviors of earth and rockfill dams during construction and initial impounding using instrumentation data and numerical modeling were evaluated by Rashidi and Haeri (2016). In this research, we have evaluated problems and difficulties related to inserting monitoring settlements and measuring instruments in earth dams [4]. The target dam is an earth dam near Yasouj, center of Kohgiluyeh and Boyerahmad province in south east of Iran. In the Shah Qasim Dam, which was exploited in the mid-1970s, there is a considerable leakage and water escape due to some problems (design, implementation and monitoring), according to field observations; for this purpose, downstream lands are drained.
Leakage from the body and abutments of a dam threatens its stability [5]. The leakage from the dam destructs the dam structure due to underwater phenomenon over time and destroys parts of Yasouj and leads to considerable damages to agriculture and industries located at downstream. Therefore, a comprehensive study is essential to investigate the problem of leakage from the body and foundation of the Shah Qasim dam. General objectives of this research are:
1. Evaluating performance of different dam components by comparing numerical and field results.
2. Determining parts of the dam which have an unreasonable function.
Geotechnical precision instrument was invented as a tool for helping workshop observations in the 1930s and 1940s. Early measuring systems of precision instruments were simple hydraulic and mechanical tools and were mostly used by experts and designers who purposefully sought to measure their estimated parameters [6]. Safety of structures must be ensured during operation; thus, monitoring of this period is a reliable and appropriate way to ensure the safety of structures. Dams like living creatures always require care and maintenance. Management of water resources and exploitation of dams and hydroelectric power stations are vital through continuous monitoring. Since observation and monitoring of earth dams is very important during construction phase and exploitation phase, therefore, suilevel tools and equipment are installed in dam foundation, lateral abutments, dam body and lateral structure and the resulting data is analyzed continuously in order to achieve this goal [7]. In addition to assessing the current behavior of a dam, availability of this type of data will allow assessment of accuracy of the predicted parameters at the design phase and provide designers and engineers with a more thorough scientific basis for designing structures to be built in the future. In the Shah Qasim Dam, no precision instruments such as strain gauges, barometers and inclinometers have been installed. Among common precision instruments, there are only piezometric and accelerator wells in the Shah Qasim earth dam.
Materials and Methods
The Shah Qasim dam is located at coordinates X = 554440 eastern longitude and Y = 3382851 northern latitude and 15 km south of the Yasouj city. It is an earth dam with thick core. Crest length is 220 meters, the river elevation is 1860 meters alongside the dam, normal water elevation is 1894, and crest elevation of the dam is 1896 meters above sea level. Volume of the lake is 9 million cubic meters and the regulated volume is 12 million cubic meters. The dam was constructed to irrigate about 1800 hectares of Servak plain in the vicinity of Yasouj and provide a recreationaltourist center for tourism attraction. Figure 1 shows its plan of geological, and Figure 2 shows position of piezometers on the body and abutments of the Shah Qasim dam [1].
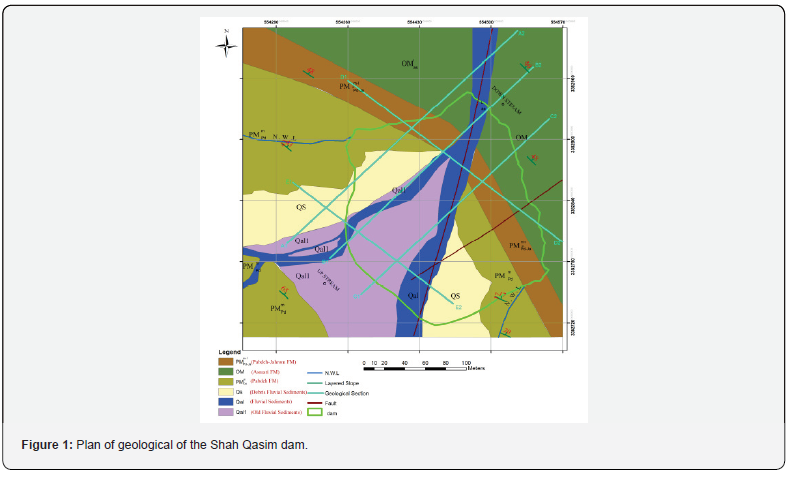
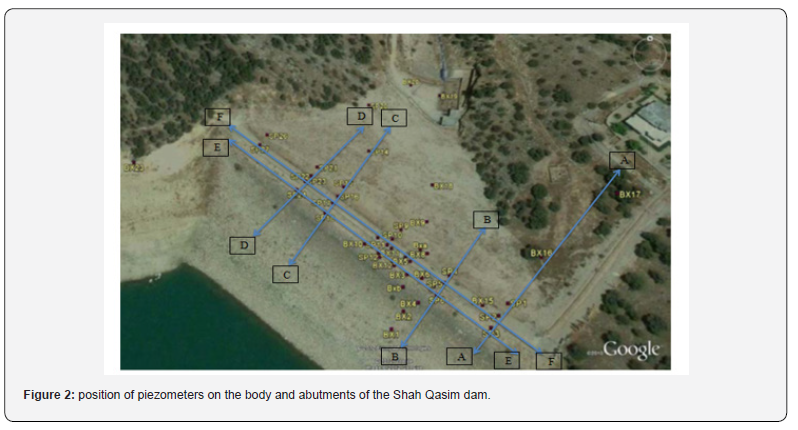
The first step in monitoring the dam is to study piezometer data of this dam. For 105 days, the height of the water level in perimeters of the dam and abutments was recorded by a catheter. To obtain calculation data, the dam was modelled in Seep/w software; boundary conditions were applied to calculate water level values in various parts. Seep/w is a software product with limited elements which can be used to model displacement and distribution of pore pressure inside porous materials such as soil and rock. Its comprehensive and extensive formulation allows analysis of simple and very complex problems of water leakage. This software is used in analysis and design of geotechnical, developmental, hydrological, and mining projects.
To quantify the difference between precision instrument data and the results obtained from numerical formula, relative error (RE) percentage was used as follows:

Greater REs indicates high difference between numerical results and precision instrument; smaller REs (closer to zero) indicate high correlation between numerical results and precision instrument. For further study, performance of piezometers existing in a longitudinal or transverse axis was examined in terms of physical principles, and physically dysfunctional piezometers were determined.
Results and Discussion
Observed and Calculated Results of Water Level
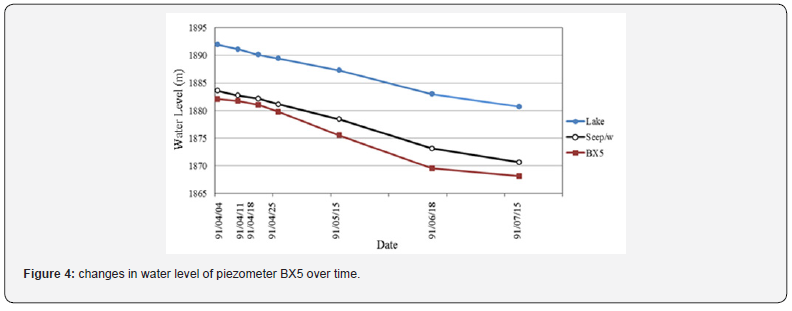
At first, water level variations of piezometers and the dam lake were plotted over time. For example, Table 1 shows variations in the piezometer SP23 and (Figure 3) shows variations in piezometer BX5. At the upper level, variations in observed data and calculated data were similar. At the lower level, observed data was more than calculated data, which was due to increased permeability. Thus, it had logical function.

It can be claimed that it functioned properly. Although the difference was greater in the lower levels, it was not high enough to cause a problem and the piezometer had no problem (Figure 4). For better comparison, variations in water level of piezometers were plotted over time for transverse and longitudinal axes.
Comparison of Transverse Axis
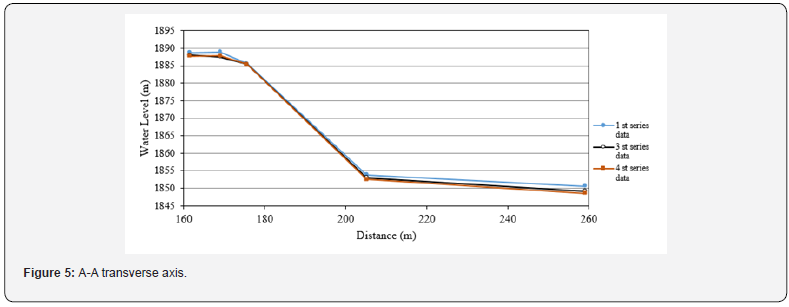
Figure 5 shows physically proper functioning of the A-A axis; water level decreased with the movement from upstream to downstream of the dam. Physically, water always moves from a higher level to a lower level. Regarding this, the concept of hydraulic gradient is presented by;

Where, 1 h is upstream pressure equivalent height; 2 h is downstream pressure equivalent height; l is the distance between 1 and 2.
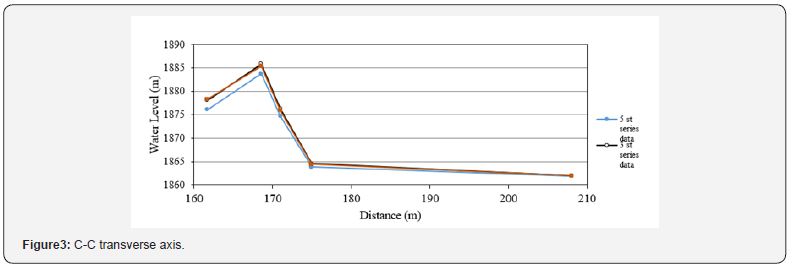
At B-B axis, water level of the piezometer SP6 was lower than water level of the piezometers SP5 and SP4. Thus, the above rule was violated because the piezometer SP6 was located on upstream, while it had lower pressure equivalent height than downstream piezometers. Therefore, the piezometer SP6 or its surroundings were dysfunctional (Figure 6). At C-C, the water level, moving from SP18 to SP17, suddenly had a high upward jump. Physically, the fluid travels from a point with more energy to a point with less energy; therefore, upstream piezometer should have a higher water level than downstream observational well. In this way, this law was violated. Thus, results of the piezometer SP18 indicate a problem (Figure 4).
Longitudinal Axis
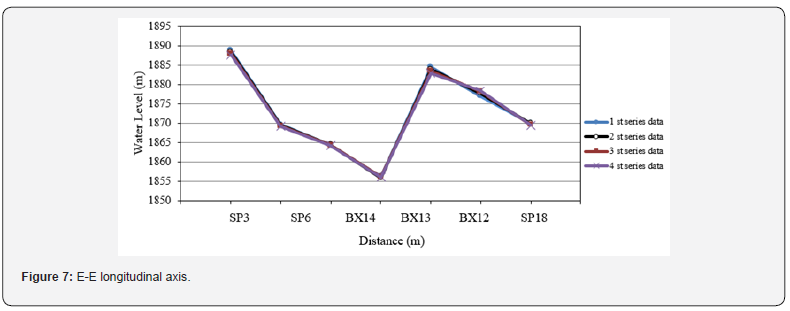
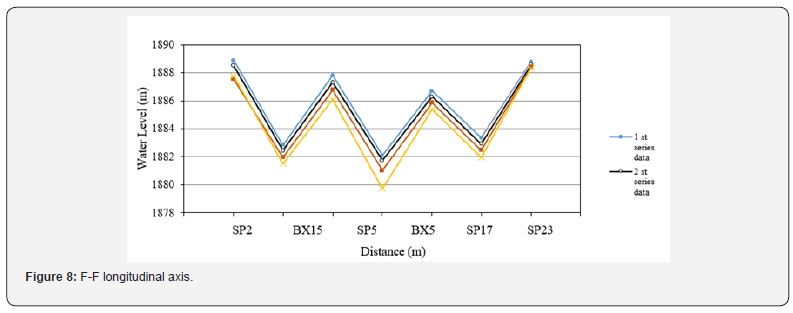
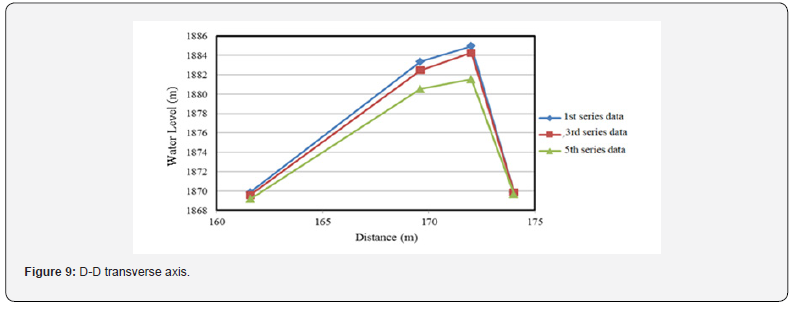
At the E-E axis, only SP3 and BX12 functioned properly and logically. Water level should be close to each other in all piezometers of this axis, while it was 15 m lower in SP6 and SP24, 20 m lower in BX14 and approximately 25 m lower in BX13. Given the close proximity of SP6, BX14 and BX13, a major problem can be expected in this area (Figure 7). All piezometers in the F-F axis functioned logically; permeability increased in their surroundings. Observed water level was more than calculated water level. Perhaps the reason for differences in water level of these piezometers can be explained by the difference in permeability along the dam and the fact that permeability changed curly along the dam (Figure 8). At the D-D axis, water level was even lower in SP24 than the water level in the last piezometer of this axis and violated physical rules, as well as the SP18. The close proximity to SP24 proves the existence of a problem in the vicinity of these two piezometers or a problem with two piezometers (Figure 9).

Conclusion
Function of piezometers is summarized in Table 2. BX4, BX14, BX13, SP6 or close proximity of these piezometers, as well as SP24 and SP18 or the area surrounding these piezometers have a fundamental problem requiring rapid examination, because water level in this area is very low; this is despite the fact that these piezometers are located above the dam. Permeability increased in the area surrounding some of the piezometers, particularly near A-A transverse axis.

For more about Juniper Publishers please click on: https://juniperpublishers.com/journals.php
For more Civil Engineering articles, please click on: Civil Engineering Research Journal
https://juniperpublishers.com/cerj/CERJ.MS.ID.555784.php


Comments
Post a Comment