Damage Evaluation in Dimension Limestone using Nonlinear Ultrasonics- Juniper Publishers
Civil Engineering Research Journal- Juniper Publishers
Abstract
Dolomitic limestone test samples with increasing levels of damage were obtained by exposing limestone samples to temperature levels of 100°C, 200°C, 300°C, 500°C, 600°C, and 700°C for a period of 90 minutes. The samples were then nondestructively tested using nonlinear ultrasonic in the form of a non-collinear ultrasonic wave mixing approach. In addition, the test samples’ degradation of flexure strength due to damage accumulation caused by the exposure to increasing levels of temperature was also obtained using four-point bending tests. Results using the currently used non-collinear ultrasonic wave mixing approach correlate well (R2 = 92%) with the corresponding obtained reduction in strength, and with results obtained using different transducer arrangements. The approach has potential applications including quantitative evaluation of damage in stone artifacts and well as to evaluate fire-induced damage in stone infrastructure.
Keywords: Limestone; Dimension stone; Thermal damage; Damage; Nonlinear ultrasonics; Non-collinear wave mixing; Safety
Introduction
Limestone is frequently used as a building material due to its wide availability, comprising approximately 10% of all sedimentary rock in the world [1,2]. Typically, limestone is formed from the skeletal remains of marine organisms, such as corals, algae, and mollusks. Dolomite [CaMg(CO3)2] forms as a result of the exposure of calcium carbonate to magnesium ions. Dolomitic limestone is composed of 50-90% calcite and 10-50% dolomite [1,2]. Historically, stone has been used as structural components in buildings such as the pyramids in Giza [3]. Since the 1800s, usage of stone as load-bearing structural component has largely stopped in favor of using steel frames [3-5]. Instead, stone is often used as non-load bearing, decorative cladding. Since the 1960s, 1-1/4 inch (30mm) thick panels anchored to masonry, concrete, or steel have been used as in façades for architectural applications. Since the late 1980s, stone-faced composite panels have also been used as decorative exteriors for buildings [6]. These panels typically consisted of a 3/8 in (10mm) aluminum honeycomb core, sided by a 1/16-inch (1.5mm) layer of stone (facing the outside) and by a thin lightweight reinforced polymeric composite layer such as a reinforced glass fiber composite panel. A study conducted by Chin [6] on the most common causes of failure of stone claddings determined that 40% of failures were due to a reduction in the strength of the stone cladding due their exposure to weather, e.g., temperature variations. Additionally, 45% of failures were due to failure of the connection between the cladding and the building and 15% of failures were due to water leakage. Both connection failures [7-9] and water leakage [10] can be addressed with building regulations and codes-many of which are already in place, such as the ones supported by American Society for Testing and Materials (ASTM) standards.
However, existing regulations and codes do not address the reduction in strength due to weathering [11-14]. Furthermore, some of the connection failures can also be attributed to loss of strength in the stone cladding surrounding the connection points [7-9, 15]. In addition, variability also exists in the quality of virgin quarried stone, differing from quarry to quarry and even between different locations in the same quarry. Unsurprisingly, when lower quality freshly quarried stone is used as cladding for buildings, it performs poorly. As an example of this is the Amoco Building in Chicago. The building was clad with 44,000 1-1/4 inch (30mm) thick Italian Carrera marble panels, which deteriorated quickly and were replaced for safety reasons with white Mt. Airy granite [16,17]. Laboratory testing determined that the marble cladding had experienced a 40% reduction in strength and an additional 30% reduction in strength was estimated over the next 10 years. In a recent study on cladding panels, Schoenberg [18] provides a review of 100 years’ worth of research into stone, with a particular focus on identifying the causes of deterioration in stone paneling. Namely, panels can warp, dish, or bow, reducing the aesthetic appeal of a building and, in extreme cases, presenting a danger of falling stone. For example, marble deterioration may be caused by a variety of mechanisms. Chemical and biological attack on old buildings and monuments have been examined by several authors [19-21], and bowing has been studied for approximately 100 years [22,23]. While most bowing studies have focused on marble, examples of bowing in limestone and in granite have also been observed [24-26]. It seems that the largest factor regarding bowing in stone is thermal hysteresis in combination with moisture, due to the thermal anisotropy of calcite crystals within the stone [27].
In two previous studies by McGovern et al. [28-30], a receiving dilatational transducer was incidentally mounted on the test specimen surface to detect the generated shear horizontal nonlinear wave. The longitudinal transducer was able to detect the resultant nonlinear wave because the shear wave traveled through a highly heterogeneous media, i.e., mesoscopic media, resulting in a significant level of mode conversion and scattering. The scattering and mode conversion lead to a random spatially incoherent normal displacement at the surface, which when averaged over the large aperture of the receiving longitudinal transducer (Panametrics V1011, center frequency of 100kHz) lead to a temporally- coherently but spatially incoherent output signal. In one of these studies [28] the two primary longitudinal waves were two critically refracted longitudinal waves using dilatational transducers mounted on shear wedges. In another study [30], the two primary longitudinal waves were sent by two incidentally mounted dilatational transducers.
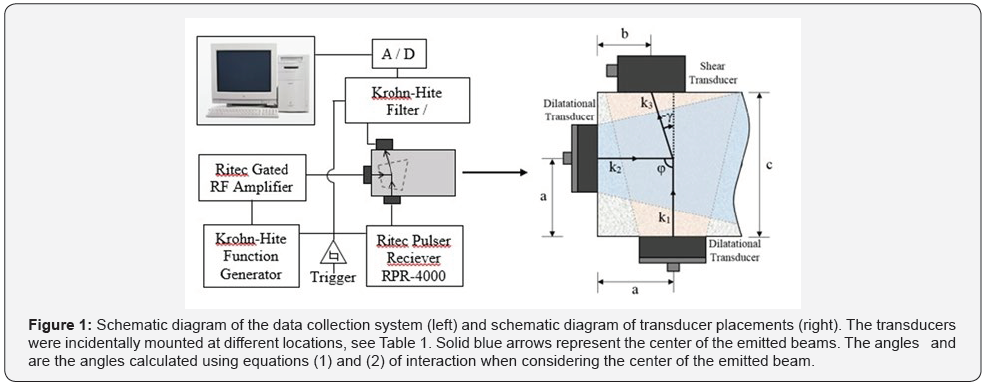
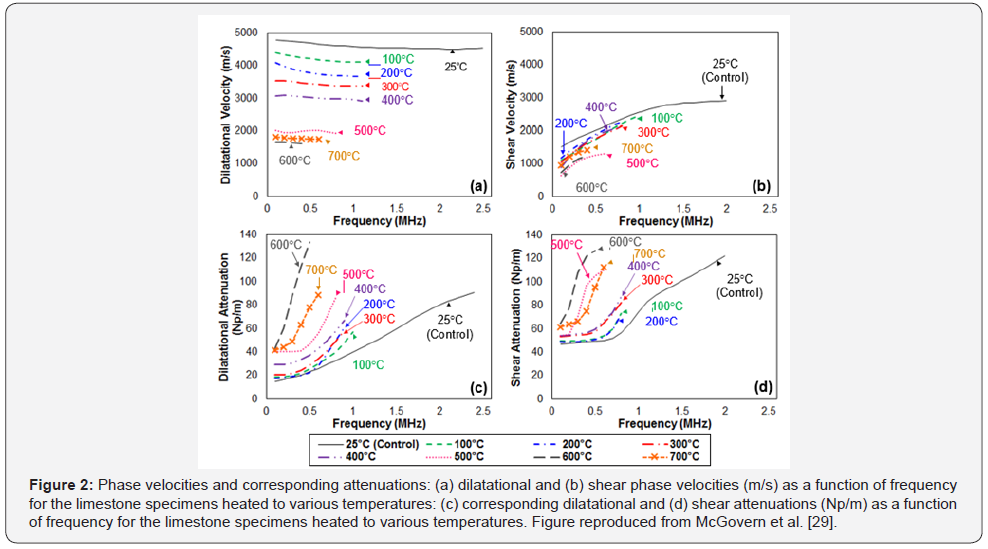
This study seeks to address whether the type of receiving transducer (shear instead of dilatational) and its placement to detect the resultant nonlinear shear wave has an impact on the observed results. In this study, the two dilatational waves are generated by two incidentally mounted dilatational transducers, and the receiving transducer is a shear transducer also incidentally mounted to the test sample. However, because the dilatational and shear velocities and corresponding attenuations depend upon the thermal damage of the specimens (see Figures 1&2), and because the overall dimension of the specimens are different from each other, the resulting shear wave meets the receiving shear transducer at a different location for each specimen, see Table 1. Please note that the overall dimension of the specimens is irrelevant provided that the relative position of the sending and receiving transducers is such that the two intercepting longitudinal waves generate the resultant shear wave, which must be captured by the receiving shear transducer.

Nonlinear Ultrasonics
Acoustic techniques for structural health monitoring have traditionally utilized principles that are valid in the linear elastic domain. Namely, when a wave propagates in a linear elastic medium it will maintain the same frequency in the presence of flaws, regardless of whether or not the amplitude and/or phase may change in the presence of flaws. Additionally, the principle of superposition holds, where the resultant wave field associated with the two intersecting waves is the sum of the two wave fields associated with the two intersecting waves. On the other hand, if a wave propagates in a nonlinear elastic medium, the frequency will not be maintained, e.g., harmonic generation [31-34]. Furthermore, the principle of superposition does not hold true when the propagating medium is nonlinear, mainly because of the presence of higher order terms in the equations of motion [35,36]. As a result, in a nonlinear elastic medium, the intersection of two waves may result in the generation of a third wave that may have different polarization, different frequency, and may propagate in different direction. However, for a resultant nonlinear scattered wave to be generated the resonance and polarization conditions need to be satisfied [35-47].
Past experiments have observed nonlinear elastic behavior when using non-collinear wave mixing, utilizing a variety of input frequencies [35-49]. Non-collinear wave mixing has been utilized successfully to determine the higher-order elastic constants in materials [41-43] and to detect degradation such as plastic deformation and fatigue damage accumulation in metals [44,49], as well as to evaluate aging in polymers [45]. Johnson et al. [40,48] observed nonlinearly generated waves in crystalline rock and developed criteria to verify that the observed nonlinear wave was caused by the aforementioned interaction of the two primary waves within the material and not by possible instrumentation nonlinearities.
Limestone has a brick and mortar type microstructure and thus exhibits nonlinear mesoscopic elastic behavior [50,51]. In such materials, the bricks (i.e., grains, crystals, impurities) interface with each other across an elastic system, which behaves as the mortar. In limestone, the mortar is a system of asperities that holds the bricks together at the grain/crystal boundaries. Because the majority of deformation occurs within the mortar, this system of asperities is the source of most inherent nonlinear response in limestone. Additionally, limestone may be subject to various sources of damage, such as freeze-thaw cycles, acid dissolution, frost action, and salt crystallization, which cause distributed microflaw populations [52]. These microflaw populations make the material more susceptible to crack propagation as the microflaws coalesce. Thus, the ultimate strength of the material is limited by the presence of these microflaw populations, which act as nuclei when the material fractures. The presence of these microflaw populations causes nonlinear distortion in propagating mechanical waves. Limestone has already been shown to exhibit nonlinear behavior by Johnson et al. [39,40,48]. In this study, test specimens with artificially induced weathering damage and different levels of damage are investigated using a non-collinear wave mixing approach by using two incidentally mounted dilatational transducers as sending transducers and using an incidentally mounted shear transducer as the receiving transducer.
Preparation of Specimens
In McGovern et al. [28-30] samples of Illinois dolomitic limestone salvaged from windowsills were cut into blocks with nominal dimensions of 155mm x 185mm x 55mm. The heating process used and discussed by Scherer and his associates [53,54] was used to induce controlled artificial damage. Seven samples were placed in an oven, in which the temperature was increased at a rate of 50 °C per 20 minutes from room temperature (~25 °C) to each sample’s individual respective desired temperature of 100 °C, 200 °C, 300 °C, 400 °C, 500 °C, 600 °C, and 700 °C. The samples were then kept at that temperature for 90 minutes. Note that 90 minutes was chosen, rather than 60 minutes used by Scherer and his associates [53,54], to ensure uniform distribution of damage, as the specimens in this experiment were larger than the specimens used in references [53,54]. After heating, the oven was turned off and the samples were left inside to cool overnight.
The linear acoustic properties of the test specimens, i.e., their dilatational and shear velocities and the corresponding attenuations were obtained and reported in McGovern and Reis [29]. For the benefit of the reader, Figure 2 shows the dilatation and shear velocities and corresponding attenuations as a function of damage, which was reproduced with permission from [29]. For additional discussion on specimen preparation and their linear characterization, the reader is refereed to McGovern et al. [28-30].

To evaluate the reduction in flexural strength caused by the temperature induced weathering process, five beam samples were cut from each of the specimens. The bending specimens were cut to the nominal dimensions of 180 x 55 x 15mm. These dimensions were chosen in order to satisfy the slenderness assumption of beam theory (h≤10 L). Before running any flexure tests, the flexure test specimens were conditioned in an oven at 60°C for 15 hours to ensure the specimens were dry. After 13, 14, and 15 hours, the specimens were weighed to ensure their weight remained constant, implying they were completely dried. The prepared specimens were loaded under four-point bending with a supporting span of 160mm and a loading span of 40 mm, using a displacement rate for the load head of 0.05mm/min. Load and displacement measurements were taken until the specimens fractured. The testing was conducted in accordance with ASTM standard [12]. Specimen width did not meet the standard, as dimensions were limited by original specimen geometry. Reduction in strength was measured with respect to the average strength of the control specimen in order to measure percentage reduction in strength. Figure 3 shows the average percent reduction in strength for each specimen (compared to the un-weathered specimen). For additional information regarding the bending tests, the reader if referred to Megan et al. [28-30].

The samples used in this study are the samples used in the study reported by McGovern et al. [28-30] after the five thin layers were removed from each sample to use as bending test samples. The remaining material (with nominal dimensions of 65mm x 185mm x 55mm) was used as the test specimens in this study, see Figure 4, where the darker areas are the result of the heavy vacuum grease used as couplant between the test specimens and the interrogating transducers/wedges.
Assessment of Damage using Non-Collinear Wave Mixing
To assess damage using non-collinear wave mixing, two monochromatic dilatational waves, 1 k and 2 k , with frequencies 1 f and 2 f , respectively, intersect at an angle, ϕ , to form a third, scattered shear wave, 3 k , that propagates at an angle, γ , with respect to k1 and with frequency f3 = f1 − f2 , where 1 2 f > f (see McGovern and Reis [28] for a more in-depth description). Following Kobbett et al. [38], For this interaction to occur, the following equations must be satisfied,
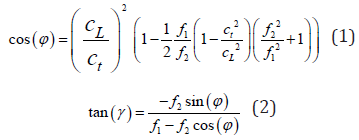
where cL and ct are the dilatational and shear velocities respectively. Notably, there are three interdependent parameters in these equations,f2/f1 , γ , and ϕ . Thus, if one of these parameters is chosen, the other two are also determined, see Figure 1.
In order to quantitatively assess the degree of damage in each of the specimens, this study compares the nonlinear wave generation parameter, β , of each specimen. To compare between specimens, the normalized nonlinear wave generation parameter, β/β0 , where β0 is the nonlinear wave generation parameter of the undamaged specimen, is used, as was the case in McGovern et al. [28-30]. A derivation of the normalized nonlinear wave generation parameter can be found in McGovern et al. [28-30], and is evaluated as:

where is the recorded amplitude of the nonlinearly generated wave, α (kn) is the experimentally determined attenuation coefficient for the wave n k , and kn D is the distance traversed by the wave kn (D =k1 = Dk2) . Because the nonlinear wave generation parameter, β , is a material property, the normalized nonlinear wave generation parameter,β/β0, should be consistent for each specimen, regardless of the frequency ratio used. This experiment seeks to determine whether the type of the receiving transducer has an impact on the measured normalized nonlinear wave generation parameter.
Experimental Setup and Data Collection
Two dilatational transducers (Panametrics V413, center frequency 500kHz) and a shear transducer (Panametrics V1548, center frequency 100kHz) are incidentally mounted as illustrated in Figure 1, see Table 1.
The location of the two sending dilatational transducers is largely dictated by specimen dimensions. In this paper, the location of the receiving shear transducer is adjusted according to the specimen dimensions and is accumulated damage to assure the resultant shear wave meets the receiving shear transducer at its center.
A schematic diagram of the experimental setup is shown in Figure 1. A pulser-receiver (Ritec RPR-4000) was used to generate an eight cycles sinusoidal toneburst, k1 , at f1 = 200kHz. A function generator (Krohn-Hite Model 5920) was used to generate an eight cycles sinusoidal toneburst, 2 k , which was amplified by a gated amplifier (Ritec GA-2500A). This signal was iteratively swept from f2 = 60kHz to f2 = 180kHz in 2kHz increments ( f2/f1
= 0.3 to 0.9). The sample rate was 50MHz to avoid trigger jitter [39,48]. For each iteration, data was averaged 350 times to mitigate the effects of noise and scatter. The received wave was filtered and amplified by a 4-Pole Butterworth filter (Krohn-Hite Model 3945), and then sent to the computer. To measure the nonlinearly scattered wave, three measurements were taken:A. A measurement with both longitudinal sending transducers transmitting.
B. A measurement with only one of the sending transducers transmitting.
C. A measurement with only the other sending transducer transmitting.
By subtracting, the two individual measurements from the measurement obtained when the two sending transducers operate simultaneously, the nonlinearly scattered wave (i.e., the difference signal) can be isolated. It should be noted that this is not a perfect subtraction to isolate the nonlinear scattered wave, as some of the energy from the primary waves is used to generate the nonlinear scattered wave. Therefore, the amplitude of both transducers operating simultaneously should be slightly lower than the sum of the amplitudes of the transducers operating individually. As a result, the difference signal, i.e., the nonlinear scattered wave includes a portion of the amplitude of the primary waves. To account for this, the resultant measurement was filtered around the theoretically predicted frequency, 3 f .
The location of the dilatational sending transducers was largely determined by specimen geometery. The location of the shear receiving transducer was determined by utilizing equation (2). For the other specimens, it was assumed that utilizing the same calculated angle, γ, would be an appropriate location, similar to the experimental method in McGovern and Reis [28]. The exact configuration of the transducers for each specimen along with specimen dimensions can be seen in Table 1. Additionally, for each independent test, all transducers were removed from the test sample, residual couplant was cleaned from the surface of the sample and the transducers, new couplant was applied to the transducers, and the transducers were affixed to the sample.
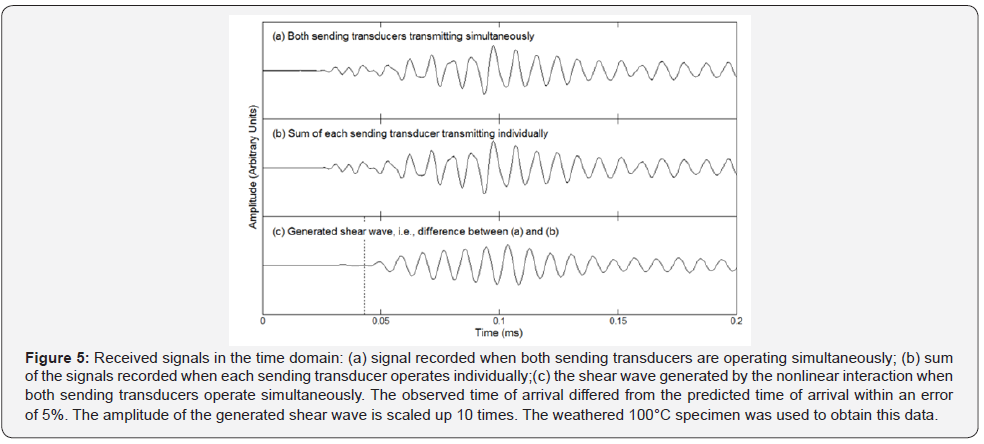
Figure 5 shows the received signals in the time domain for the un-weathered 25°C specimen. Figure 5a shows the signal recorded when both sending transducers are operating simultaneously, and Figure 5b shows the sum of the signals recorded when each sending transducer operates individually. Figure 5c shows the scattered shear wave generated by the nonlinear interaction when both sending transducers operate simultaneously. The observed time-of-arrival differed from the predicted time-of-arrival within an error of 5%. In Figure 5, the amplitude of the generated shear wave is scaled up 10 times.
Experimental Results
When analyzing the collected data, the Johnson et al. [39] selection criteria was used to ensure the observed signal was in fact the nonlinearly generated scattered shear wave and not an artefact of equipment nonlinearities such as nonlinearities in the used couplant, amplifiers etc. Namely, the amplitude criteria was met by varying the voltage of the primary waves and noting that the received scattered wave amplitude changed in a manner proportional to the primary scattered wave amplitudes. The directionality criteria was also met by the nature of the experiment, i.e. placement of the sending and receiving transducers. The time-of-flight criteria was met by observing that the experimental arrival times were consistent with the expected arrival times for the nonlinearly generated signal.

To identify the frequency ratio that produces the maximum amplitude of the nonlinearly generated shear wave, one transducer was set to send a 200kHz signal for each test, whereas the signal for the other transducer was swept from 60kHz to 180kHz in 2kHz intervals. A sample of experimental results for one frequency sweep can be seen in Figure 6. Figure 6 shows the frequency ratio that experimentally corresponds to the observed maximum amplitude as compared with the theoretical predicted frequency ratio. The discrepancy between theoretical and observed peak frequency ratios are attributed to the mesoscopic behavior of limestone, deviations from the theoretical assumptions used in the non-collinear wave mixing formulation [38], and the transducer placement used in this study.
Please note that under the assumptions associated with to the traditional non-collinear wave mixing formulation [38], i.e., plane longitudinal primary waves and homogeneous isotropic material, the nonlinear wave shown in Figure 5 would have zero magnitude. However, mainly because of the beam spread of the two primary waves and the mesoscopic behavior of the material, the resultant nonlinear wave has a finite amplitude, as it is illustrated in Figure 5.

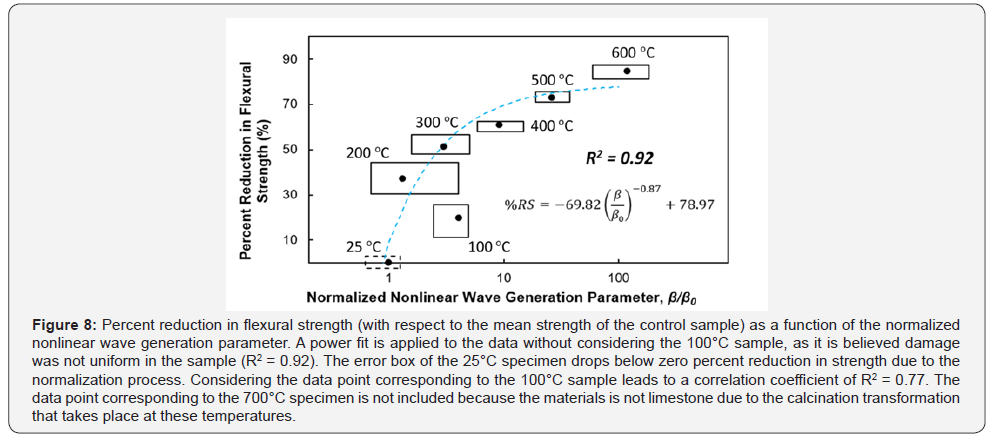
Figure 7 shows a comparison of the results obtained in this experiment with various other transducer arrangements used in past experiments by McGovern et al. [28-30]. Notably, there is a discrepancy between the normalized nonlinear parameter for the 100 °C specimen between this experiment and past experiments. This deviation is explained by the presence of residue in the 100 °C specimen left during the cutting process using oil to cool the cutting saw. This residue was burned off for higher temperature specimens, but for the 100 °C specimen the temperature was not sufficiently high. In addition, the damage distribution for the 100 °C specimen was not uniform throughout its volume because of the lower temperature. Apart from the 100 °C specimen, observed normalized nonlinear wave parameter values match closely to previous studies utilizing dilatational receiving transducers, which validates previous experiments and implies shear transducers and dilatational transducers can both be used as receiving transducers to determine the normalized nonlinear wave generation parameter, see McGovern et al. [28,30]. In Figure 7, as it was also observed in previous experiment [28-30], the normalized nonlinear parameter changes drastically from the 600 °C specimen to the 700 °C specimen. This is due to the calcination transformation that takes place at these temperatures. For additional information regarding the calcination decomposition, the readers are referred to [28-30, 55,56].
Figure 8 shows a correlation between the normalized nonlinear wave generation parameter and the reduction in flexural strength (R2 = 0.92). The Figure also shows that the percent reduction in flexural strength error box is negative for the control specimen. This is an artefact of the normalization process, as percent reduction in flexural strength is measured with respect to the mean flexural strength of the control specimen. Apart from the results of the 100 °C specimen, the power fit seems to accurately relate the normalized nonlinear parameter with the reduction in flexural strength. The data point corresponding to the specimen damaged using the 100°C is not included because of the lack of uniformly distributed damage in the 100oC specimen; because the specimens were cut using oil as the saw lubricant, and the 100°C was not sufficiently high to eliminate/reduce the oil residue in the middle of the specimen.
Finally, results of the receiving transducer placement shown in Table 1 also indicate the maximum deviation from the position selected for the undamaged specimen is about 15mm for the 600 °C specimen. Note that the 700°C specimen is not considered mainly because is a much thinner specimen, i.e., it has a lower value of the dimension c = 33mm, as compared to the other specimens, see Table 1. Considering that the diameter of the receiving shear transducer (Panametrics V1548, center frequency 100kHz) is 38mm (1.5in), a conclusion can be reached that one can place the receiving transducer assuming the material properties of the undamaged specimen without altering the results, as it was done in previous studies by McGovern and Reis [28-30].
Conclusion
Dolomitic limestone specimens were artificially weathered at temperatures of 25°C, 100°C, 200°C, 300°C, 400°C, 500°C, 600°C, and 700°C. Non-collinear wave mixing of two dilatational waves was used to generate a scattered shear wave. This interaction of the two intercepting longitudinal waves was used to characterize the limestone specimens of varying degrees of thermal damage. While the resultant scattered shear wave was captured using a shear transducer mounted on the test specimens’ surface, its location varied from specimen to specimen because the velocities of each specimen depend of its damage accumulation. This study shows that the use of both dilatational and shear transducers as receiving transducers is acceptable, i.e., both lead to relatively similar normalized nonlinear wave generation parameter values,β/β0 . It was also observed that placing the receiving transducers are different locations did not significantly affect the results mainly because of the relatively large diameter of the receiving sensor, which validates the simpler approaches used by McGovern et al. [28,30], where the relative location of the transducers’ placement is constant. This approach has the potential to quantitative evaluate damage in monuments and art objects for the purpose of taking remedial actions as discussed by Scherer and his associates [53,54], as well as to evaluate fire induced damage in stone such as in tunnels.
For more open access journals, please click on: Juniper Publishers
For more civil Engineering articles, please click on Civil Engineering Research Journal
https://juniperpublishers.com/cerj/CERJ.MS.ID.555755.php


Comments
Post a Comment