Acoustic Emission Testing of Composite Materials Including Specimens Simulating the Embedded Sensors- Juniper Publishers
Civil Engineering research Journal- Juniper Publishers
Abstract
Composite materials including fiberglass and carbon fiber together with the necessary strength provide a sufficient saving the weight for structures of any shape and allow to realize unique characteristics due to their application are finding wider application in the creation of structures. This requires the development of a reliable non-destructive method for assessing their condition, including during operation, what is of no less importance since it allows to reject materials with defects even before structural elements are made of them. The evaluation of possibility to use the acoustic emission (AE) scanning method based on EMA type equipment for fiberglass specimens was conducted. Numerous experiments were performed on scanning specimens in the longitudinal direction, in which each of the AE sensors alternately acted as an emitter of test signals. Of the six specimens tested, three contained an integrated center element simulating an acoustic piezoelectric transducer. Tests have shown that with AE scanning it is possible to distinguish acoustic properties without loading specimens in the presence and absence of such an integrated concentrator and to quantitatively assess the damage for material with concentrator. Also, the unique for EMA systems automatic prediction of destructive loading for both materials were tested during specimens tension up to crash. The importance of the results obtained for creating a methodology of composites testing using AE scanning technology and providing clear criteria for assessing damage is noted.
Keywords: Acoustic; Emission; AE; EMA; Scanning; Destruction; Forecast; Damage; Composites
Materials and Methods
E.O. Paton Electric Welding Institute. NAS of Ukraine conducts the AE (acoustic emission) series of testing specimens from the Udo UD CST 150/300 composite material based on the ARALDITE 564 binder and fiberglass made of Aeroglass 280 fiberglass and Elan-tech EC157 + Elan-tech W152XLR bonding material, manufactured by the N.E. Zhukovsky National Aerospace University “Kharkiv Aviation Institute”. Both two composites delivered in state which corresponds their real use in aviation structures, including thickness of specimens [1-5].
The AE technology and equipment were a main instrument for obtain experimental data. The destructive tests were conducted on the tensile machine with a hard mode of loading. The studies on the acoustic conductivity of the materials tested and the accuracy of the sources of AE signals coordinates location on specimens tested were carried out using sensors DAE-01, each of which was alternately used as a generator of acoustic waves. If the initial purpose of the experiments described in previous paper was to determine the principal testability of one only composite material using sensors, equipment, and AE technologies implemented using EMA-4 instruments (Figure 1) so next stages deals with two composite materials and wider spectrum of tests.

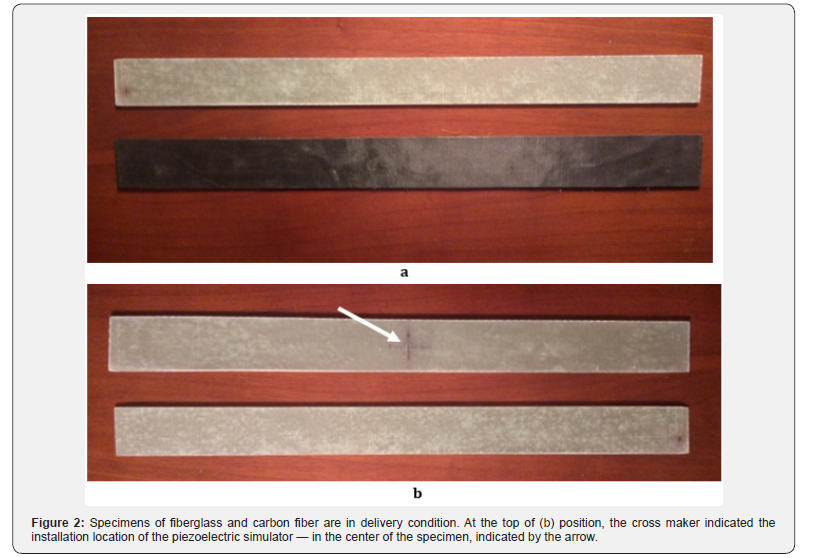
The specimens of fiberglass and, so, carbon fiber, manufactured by the National Aerospace University are thin longitudinal strips, measuring 400x35x2.1mm (Figure 2). Specimens of fiberglass are made (Figure 3-5) by the manual display of Aeroglass 280 fiberglass and Elan-tech EC157 + Elantech W152XLR binder (mixing ratio 100: 30). The molding was carried out on a flat duralumin plate using a vacuum method with vacuum impregnation of a dry blank of Aeroglass 280 fiberglass fabric and pre-installed simulators of sensor sensors made of CaCO3 calcium carbonate 0.5mm thick and 5mm in diameter. Forming pressure 0.09 MPa. Time-temperature molding after impregnation: 60 °C for 6 hours. Specimens with the required dimensions were cut from the formed plate with a diamond disc.

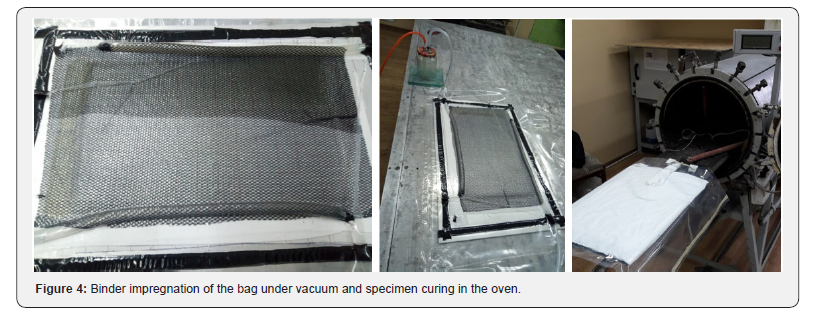

The sensors were placed at a short distance from the edge of the specimen, so that they formed a linear location antenna with a total length of 330mm (Figure5). When installing the third sensor, it was placed in the center of the specimen (in the case of a piezo sensor simulator, directly above it). And, in additional to traditional destructive AE tests of specimens, the different method was used naming “AE scanning”. This method based on sounding of specimen without its loading. In this case, one of AE sensors uses as radiant of acoustic waves, and other as receiver. If the specimen of original, not damaged material present, the comparison of acoustic properties of this material and damaged material allows obtaining the numerical value of damage.
The criterion for assessing the danger of damage accumulated in metal structures was represented as ΔWmid=1-vdam/vbase , where a characteristic that has a sense of the rate of increase of the signal to the maximum serves as an acoustic parameter to evaluate the degree of material damage. v = A / Rt, where A is the amplitude of the output signal, Rt is the time of its increase to the maximum for the source (“base”) and damaged (“dam”) material. It was shown that if the speed v for the accumulated material is less than for the original material, then irreversible damage has occurred in the material. The verification of quantitative damage indicators determined by AE scanning was performed by several physical methods including direct weighing of small specimens in a liquid. The final stage of experiments was the check of EMA systems automatic forecast of destructive loading in application to tested materials.
Results and Discussion
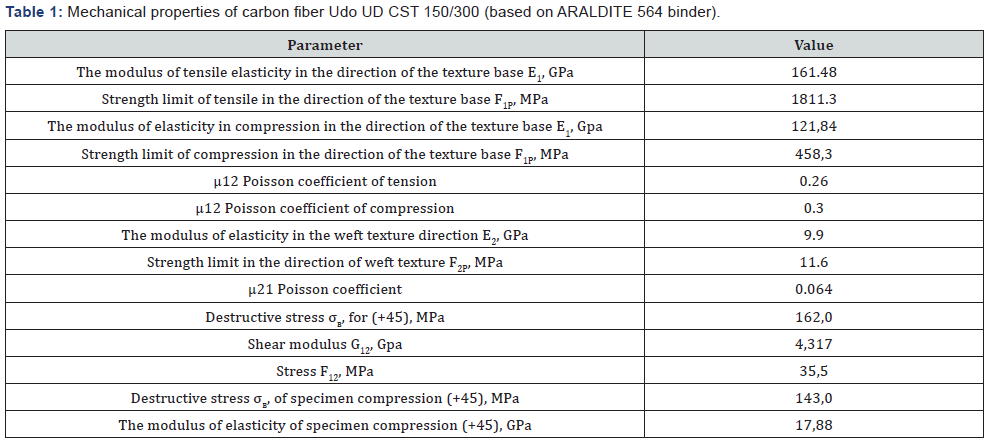
The first experiments showed that the materials under study has a high acoustic sensitivity comparable to that of many metals. The passage of AE waves through the material was normal. The ability to determine the coordinates of the signals was provided with enough accuracy. In addition, manual tapping of the specimen with a thin metal rod in different directions was performed, and the coordinates were also determined well. The presented experiments were repeated several times, and the results of their processing showed that, firstly, this material is testable from the point of view of AE, and, secondly, provides the necessary accuracy in determining the coordinates of AE sources Table 1.
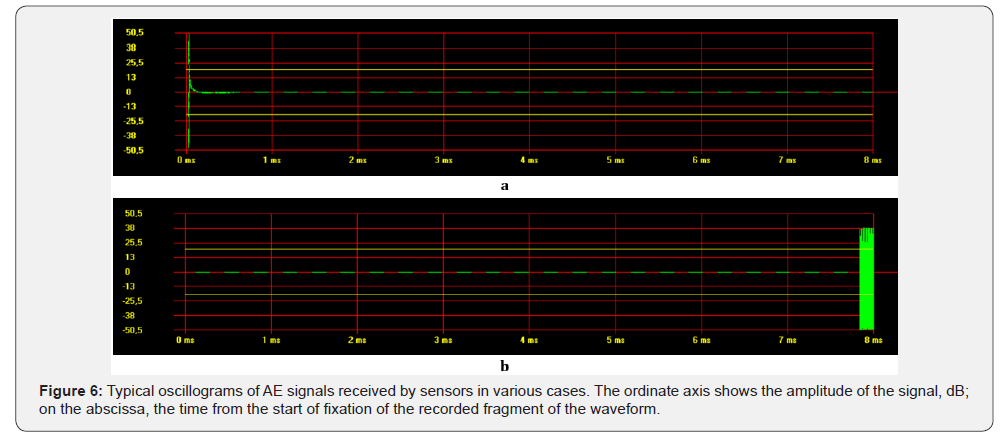
Experiments have shown that the fiberglass under investigation has a high acoustic sensitivity, not worse than carbon fiber. The emitted square wave signal had the following parameters: amplitude 3V, frequency 60KHz, duration 7μs. When the sensor received a signal that was little distorted, it received an oscillogram similar to that shown in Figure 6a, when changing the signal parameters, the oscillogram most often looked like the one shown in Figure 6b.
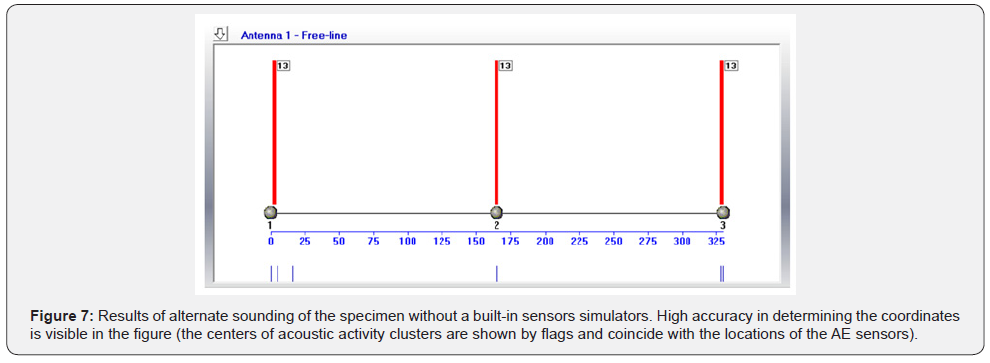
When determining the location of AE sources using sensors as a generator of waves, the velocities of AE waves in the material were selected so that the calculated coordinates of the AE signals emitted by the sensors and then received by the AE device, as accurately as possible coincided with the coordinates of the sensor-emitter (Figure 7). This figure like next similar figures is a screenshot of EMA-3.9 program window part. Lower part show coordinates of AE events obtained before their cluster analysis as small bars. Big bars with flags are results of clustering. Numbers on the flags shows the AE events count in corresponding cluster.
One of the next stages of researches was to obtain using the AE method whether embedded small AE sensors had influence on the state of tested materials. To ensure the correctness of the scanning results, several criteria are used. First of all, within the framework of each single test, the parameters of the signals received by the sensor should be stable, without significant scatter. Secondly, when two sensors are alternately used as receivers alternately located on opposite sides of the specimen, their data should also not have significant differences in parameters.
As part of this work, about a hundred experiments on six specimens were carried out to obtain the necessary statistics of stable results, three of which had a built-in simulator of a piezo sensor with a diameter of 5mm in the center, which is close in some properties to the PZT19 material used in real piezoelectric sensors. Typical graphs of the results of AE scanning of three specimens without a built-in piezo sensor simulator are shown in Figure 8. In the left column of the graphs for the case when the emitter was sensor 1, in the right column is sensor 2. The bars show depending on the time of the AE signal receiving amplitude A, and dots show the time of their rise to the maximum Rt. When processing the measurements, software filters were used that cut out obviously incorrect data (for example, Rt = 0μs).
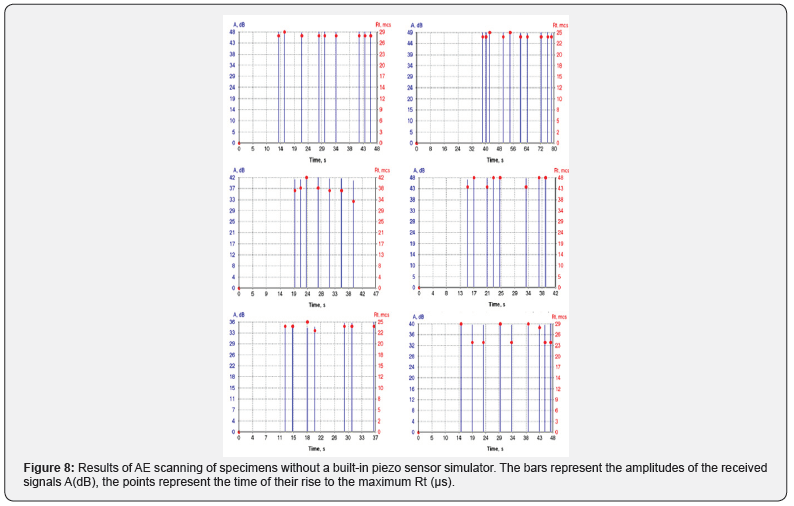
As you can see, the results are fairly stable. Although for different specimens and for different scanning directions there is some difference in the obtained values of the amplitudes A and the rise times of the signal Rt, within the framework of each specific experiment their repetition is high. Note that the minimum amplitude is 36dB, the maximum value of Rt is 48μs.
Further, it will be shown that these parameters for specimens with a piezo-sensor simulator are changed in the same way as previously shown for other materials the amplitude of the received signal in the damaged material decreases, and the rise time Rt increases. Characteristic of this material is an insignificant, close to the statistical variation, a decrease in the amplitudes of the received signals in the damaged material with a significant increase in Rt.
In each specific test, it is clearly seen that the obtained amplitudes of the AE signals received from A signals had a smaller scatter than their rise time to a maximum of Rt. This phenomenon is most likely due to the fact that the scanned material has a heterogeneous, layered structure. Even in the absence of internal defects, the features of the structure can lead to a change in the waveform, without affecting its power, as expressed by the amplitude.
Typical graphs of the results of AE scanning of three specimens with a built-in piezo sensor simulator are shown in Figure 9. In the left column, as in Figure 8, graphs are presented for the case when the emitter was sensor 1, in the right column-sensor 2. To calculate the damage of specimens with a piezo-sensor simulator, the AE parameters obtained by scanning specimens without piezo plates with the same number were used as the initial data. Theoretically, they could be interchanged in any order, since they were cut from the same sheet of material, and the averaged data are not significant. The data was processed in MS Excel. For each specimen, the values of A and Rt were obtained for each of the directions of sounding, then the amplitude growth rate of amplitudes v = A / Rt, the damage in each particular case of scanning was calculated. On Figure 10 the results of damage ΔW calculation after scanning for specimens No. 1, 2, 3 are shown by six blue columns. The number under each column corresponds the number of each one scanning experiment. The designation ΔW 1-> 2 shows the damage obtained by scanning with signals in the direction from sensor No. 1 to sensor No. 2, and then by analogy for all the specimens, ΔW 2-> 1 shows the damage for scanning in the direction from sensor No. 2 to sensor No. 1, and then by analogy for all the specimens. Further, the average damage value for each of the specimen and scanning directions was calculated and shown on fig. 10 as the red columns No. 7.
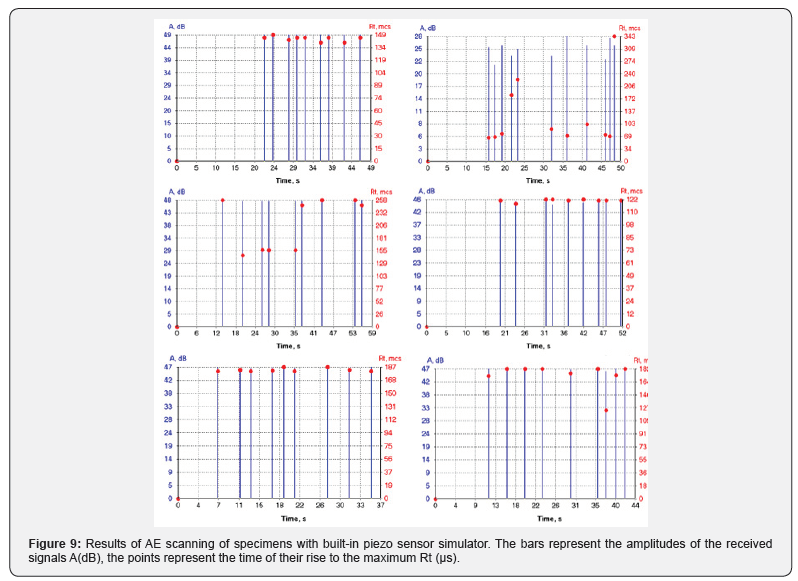
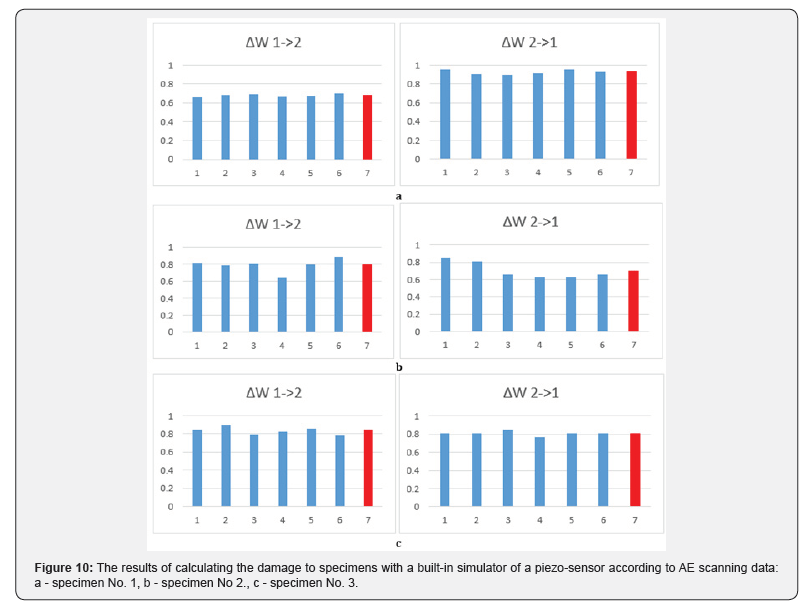
The analysis presented in Figure 9&10 of the data shows, firstly, the high damage of all three specimens with built-in piezoelectric simulators, which for individual series of specimen scanning ranges from 0.65 to 0.95. Secondly, the specimen No. 1 seems to be the most damaged, for which the highest average damage is recorded when scanning from sensor No. 2, and, in addition, there is a very large scatter of measured data, which was noted for the upper right graph on Figure 9 which indicates the unevenness of the properties of the scanned material in this direction.
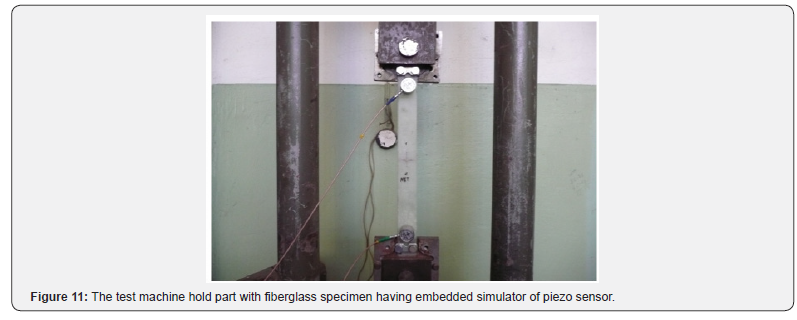

It is important to note that such large damage values were obtained when scanning specimens in only one direction. The real integral damage of the material may be differed. Theoretically, in subsequent tensile tests, down to rupture, the AE pattern should differ significantly in the direction of increasing the number of AE events for specimens with embedded simulators of piezoelectric sensors Table 2. The places of the greatest AE activity in the area of simulators should also be recorded, since they are stress concentrators. Later, such experiments were conducted. The fiberglass specimens of both types were tested on destructive machine with hard mode of loading (Figure 11).
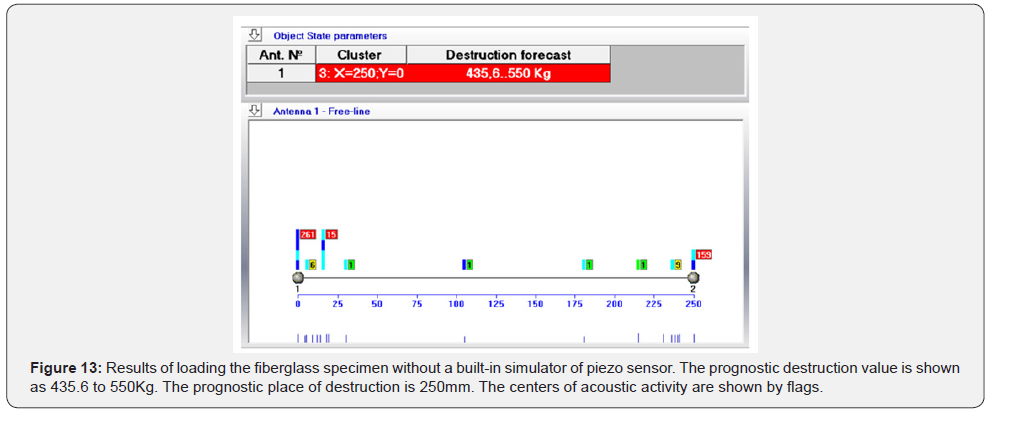
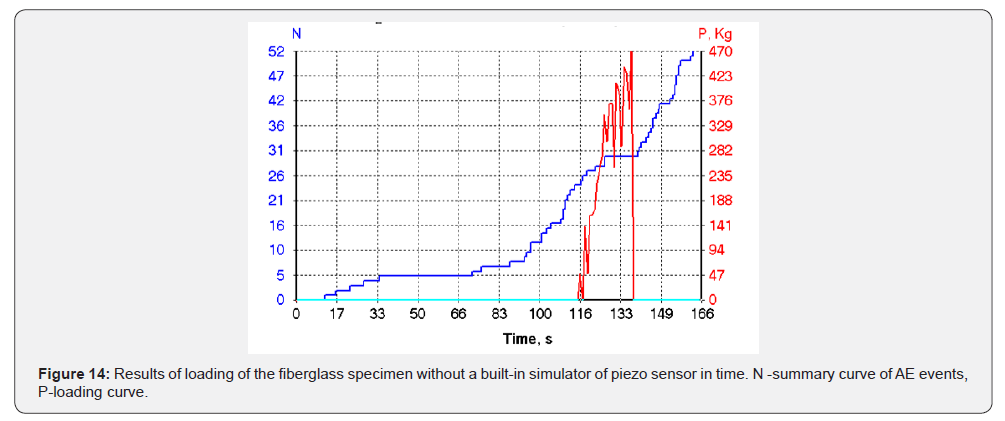
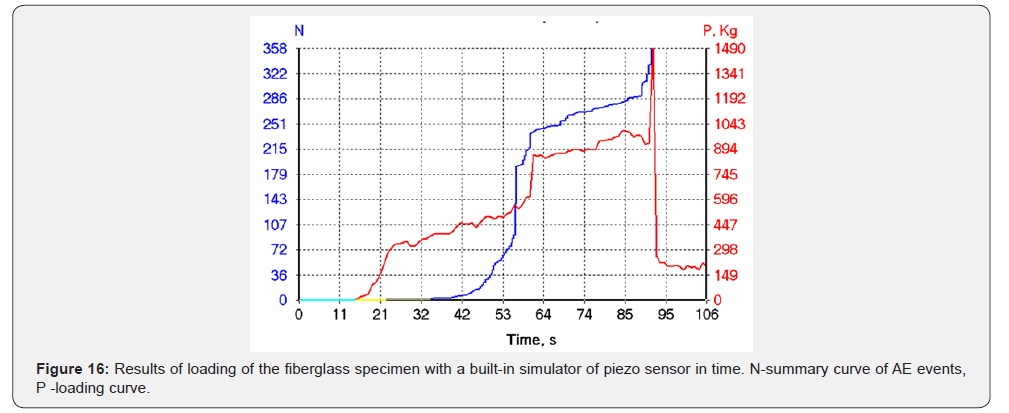
The results of testing of specimen without embedded carbon plate shown that more acoustic signals were radiated by the area of the testing machine holds in which the specimen is fixed. Specimen practically has no serious defects. Destruction occurred in the hold part of a testing machine (Figure 12). Lower some screens of EMA-3.9 program for this experiment is shown. Location scheme (on the bottom) combined with destruction Figure 13 forecast area (on the top). On Figure 14 all loading process is shown. As we can see the forecast of destruction 435.6 to 550Kg is very close to real destructive load 470Kg.
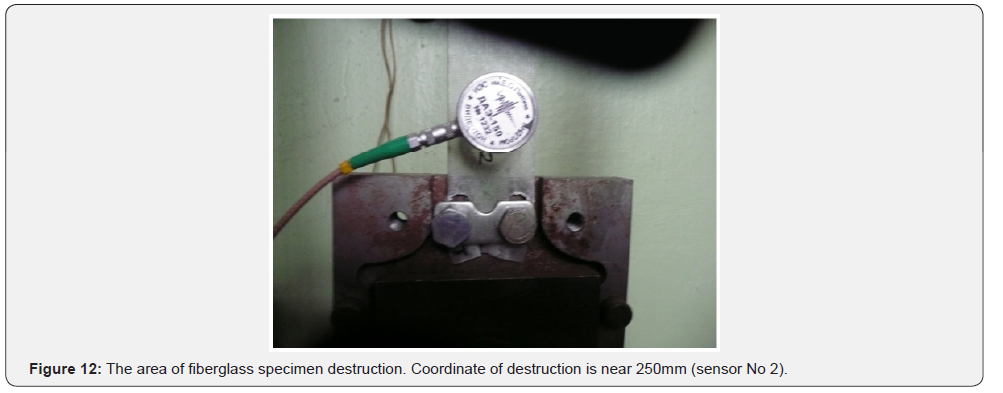
In the results of testing of specimen already with embedded carbon plate we can see that more acoustic signals again were radiated by the area of the testing machine holds. Specimen with built-in simulator of piezo sensor shows some acoustic activity in the center when the embedded carbon plate placed (Figure 15). But it is not critical activity. Destruction, the same as in specimen without carbon plate, occurred in the hold part of a testing machine (Figure 12).
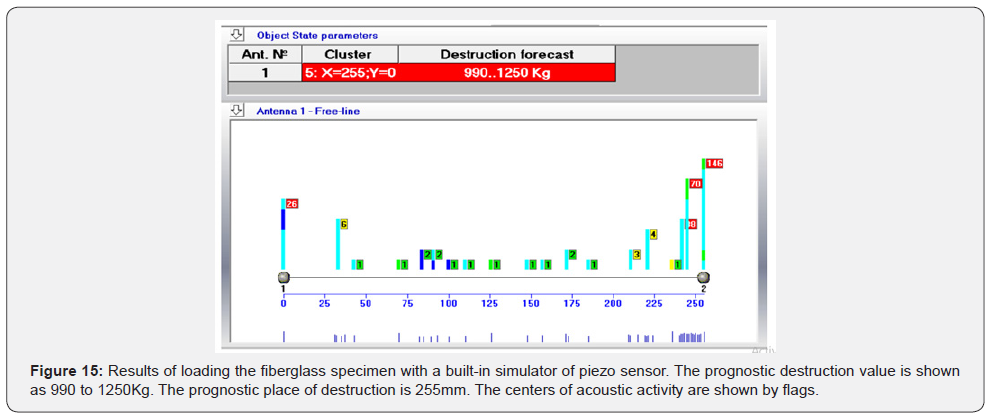
As we can see the forecast of destruction 990 to 1250Kg is enough close to real destructive load 1490Kg.
In conclusion for fiberglass next main results obtained:
1. AE tests conducted shown that prognostic properties of EMA systems works good with fiberglass.
2. The large level of damage which AE scanning shows relates to global changes of acoustic properties in fiberglass material which have arisen during carbon plates installation and thermal treatment.
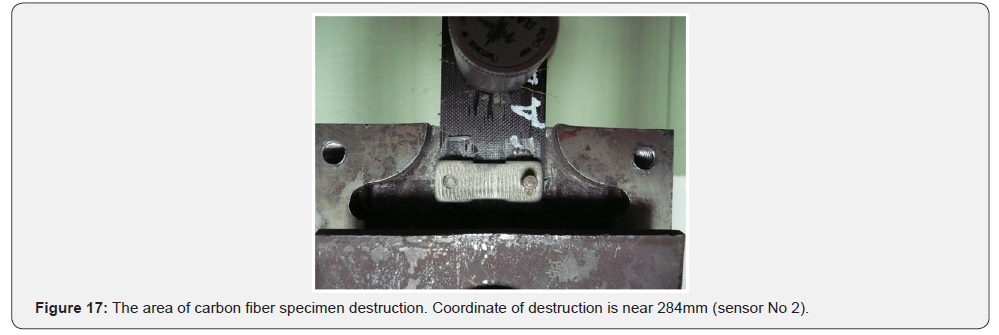
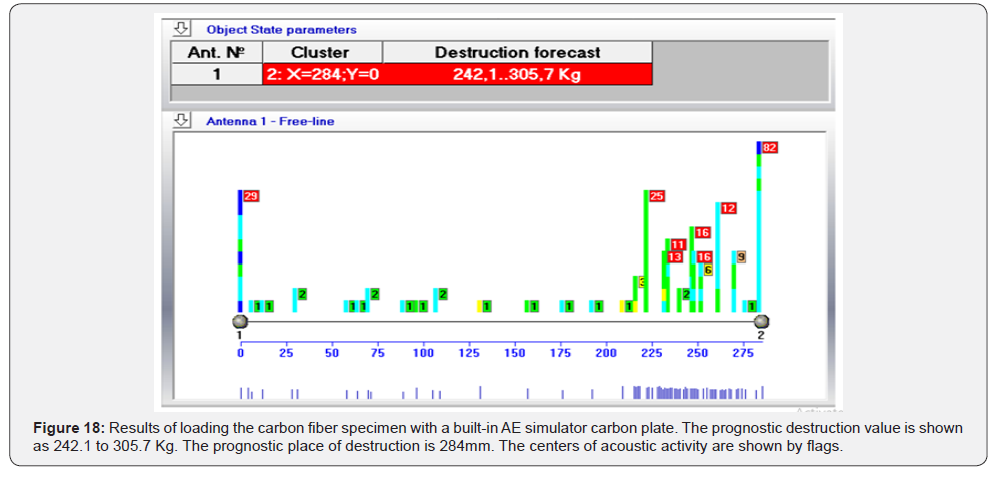
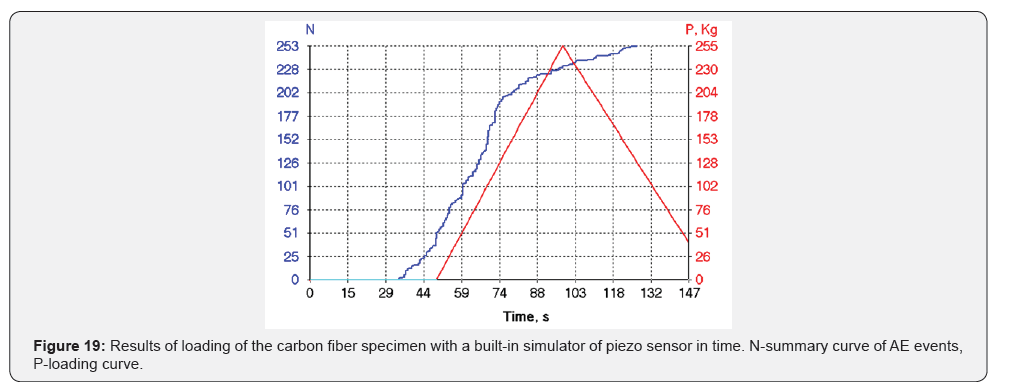
Analogous experiments were conducted with carbon fiber specimens with embedded sensor simulators Figure 16. The main result of specimen’s destruction was the same as for the fiberglass, near hold part of the testing machine (Figure 17). As we can see the forecast of destruction 242.1 to 305.7Kg is very close to real destructive load 255Kg. So, AE tests conducted shown that acoustic sensitivity and prognostic properties of EMA systems are good both for carbon fiber and fiberglass Figure 18. The quality of destruction forecast no worse than when testing real steel pressure vessels. This confirms generally good chances for using the AE method in assessing the state of composites. The obtained results suggest that it is possible in principle to create a method of applying the AE technology into practice when monitoring composite materials of tested types, both in standard destructive testing and scanning without loading. This requires further research in this direction Figure 19 and obtaining a set of statistical data that would establish the necessary safety criteria for the operation of structures made of composite materials tested by the AE method.
Conclusion'
A. Researches have shown that the glass fiber plastic made of Aeroglass 280 fiberglass and Elan-tech EC157 + Elan-tech W152XLR bonding material and Udo UD CST 150/300 composite material based on the ARALDITE 564 binder are testable from the point of view of the AE method, it allows to determine the coordinates of AE sources with sufficiently high accuracy during test sounding and emits AE waves during deformation and destruction.
B. The material sounding named here “AE scanning” allows evaluate the damage without loading of specimens. Additional research can clearly improve the AE scanning criteria characterizing the damage of materials.
B. The material sounding named here “AE scanning” allows evaluate the damage without loading of specimens. Additional research can clearly improve the AE scanning criteria characterizing the damage of materials.
D. It is shown that with the use of AE systems of the EMA type a forecast of the destructive loading for the studied composite materials is possible.
For more open access journals, please click on: Juniper Publishers
For more civil Engineering articles, please click on Civil Engineering Research Journal
https://juniperpublishers.com/cerj/CERJ.MS.ID.555754.php


Comments
Post a Comment