Stress-Settlement Model of Piles in the Coastal Regions of Nigeria- Juniper Publishers
Civil Engineering Research Journal- Juniper Publishers
Abstract
A model that predicts the settlement of pile in the coastal regions of Nigeria (Lekki, Aja, Ikoyi, Victoria Island, Magodo, Ikorodu, Ipakodo and Festac) in Lagos was studied through the use of statistical analysis. Descriptive analysis, parametric test, correlation and regression were used to determine a significant relationship between stress and its settlement. A predictive model describing the relationship between stress and maximum settlement of these piles was generated. The results reveal that the settlement increased by 0.0009mm for every one-point increase in stress. A predictive stress-settlement model was developed with a regression coefficient of 0.8428. The model may be useful in providing settlement information on piles driven within the Lagos.
Keywords: Static pile; Load test; Load settlement response; Predictive model; Coastal region
Introduction
The steady increase in the rate of urbanization within the coastal region of Nigeria, necessitated by the increase in population in the area is quite remarkable. A number of factors are responsible for this increase, one of the reasons is the presence of oil exploration and exploitation companies in the region. This has made Government, and many multinationals invest in the region, thus creating infrastructure driven investments opportunities such as loads, buildings, bridges, water retaining structures, transmission towers among others, and the resultant high ingress of people to the region. There is therefore an increase in the demand for pile foundation to support these structures as they are principally used to transfer the large loads from superstructure, through weak, compressible strata, or water onto a stronger, more compact, less compressible and stiffer soil [1].
Burland et al. [2] pointed out that traditionally engineers have asked themselves how many piles are required to carry the weight of the building and claimed that designers should perhaps better ask themselves the question of how many piles are required to reduce the settlement to an acceptable limit. The number of piles in answer to the second question is invariably significantly less than in answer to the first question.
There are a number of compelling arguments for moving towards a settlement-based design methodology for pile foundations, and since 1977 a number of interesting developments have occurred in this direction, including some outstanding applications [3,4] nevertheless, the capacity-based design is still dom inant, as is evident for instance in current revisions of national and regional design codes. Venkata [5] developed a simple but rational method of estimating settlement of pile groups based on load transfer approach for single piles and equivalent pier method. The method takes into account layered soil system and makes use of input parameters obtained from usually conducted field tests such as standard penetration test (SCPT) in cohesionless soils and consolidation test in cohesive soils. Chandra et al. [6] addressed the issue of settlement of pile-supported structures due to the loss of pile capacity in liquefied soil. A simple mathematical model that can be implemented in an EXCEL type program was proposed for characterizing the above phenomenon. The method used envelopes of unit load transfer curve that describes the axial load transfer mechanism of the pile foundation in liquefied soil. Tomislav et al. [7] analyzed the bearing capacity and settlement of bored piles, as the most frequently used type of piles in local practice. It was observed that empirical methods based on geotechnical soil parameters for capacity estimation, introduced some simplifications which lead to neglecting certain elements of a complex pile-soil interaction. On the other hand, the results of pile field testing methods were a direct summary consequence of the overall complex conditions on pile-soil contact. This study will provide an in-depth understanding of the settlement of piles in the coastal region of Nigeria and subsequently, develop a pile settlement- stress model [8,9].
Area of Study
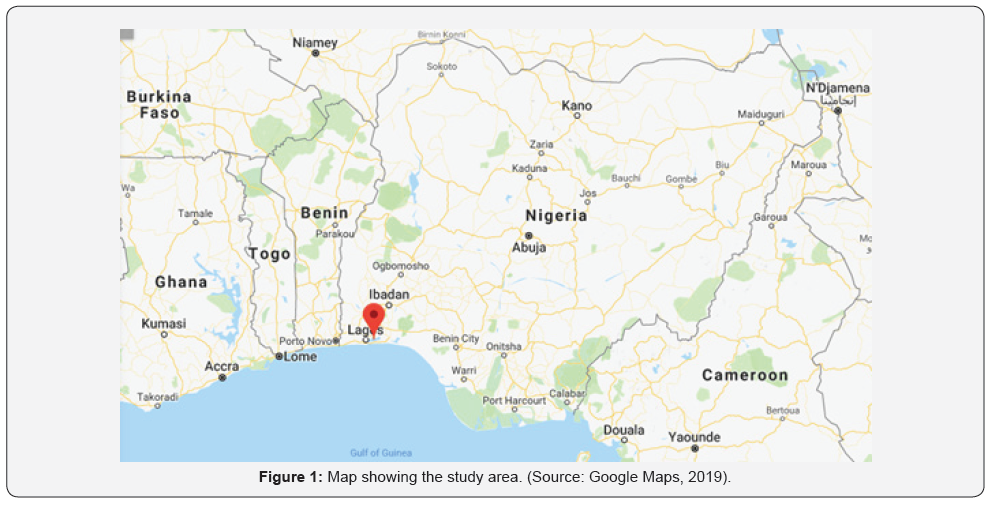
The study area is situated in Lagos, Nigeria with latitude 6.465422°N and longitude 3.406448°E with the gps coordinates of 6° 27’ 55.5192’’ N and 3° 24’23.2128’’ E shown in Figure 1. Static Pile load tests were carried out on five locations within the study area. The locations include Lekki, Aja, Ikoyi, Victoria Island, Magodo, Ikorodu, Ipakodo and Festac Figure 1.
Materials and Methods
Static load test
Static load test of a pile or group of piles is used to establish an allowable load. This was carried out on piles located in Lekki, Aja, Ikoyi, Victoria Island, Magodo, Ikorodu, Ipakodo and Festac. The applied load is usually maximum of 150 % to 200 % of the design safe working load. These tests were guided in accordance to the Geotechnical Engineering Bureau (2007).
Equipment and Instrumentation for Static Load Test
The major equipment includes the following:
1) Test beams - primary and secondary
2) Bearing plates3) Hydraulic jack of appropriate capacity (800 tons); connected
to hydraulic pump
4) Oil manometer of suitable capacity
5) Kentledge or dead weights (normally in form of concrete cubes of 1m3 and 24kN or 2.4 tons), etc.
6) Steel reference beams
7) Dial gauges, capable of measuring movements within an accuracy of 0.01mm.
Arrangement of load test platform
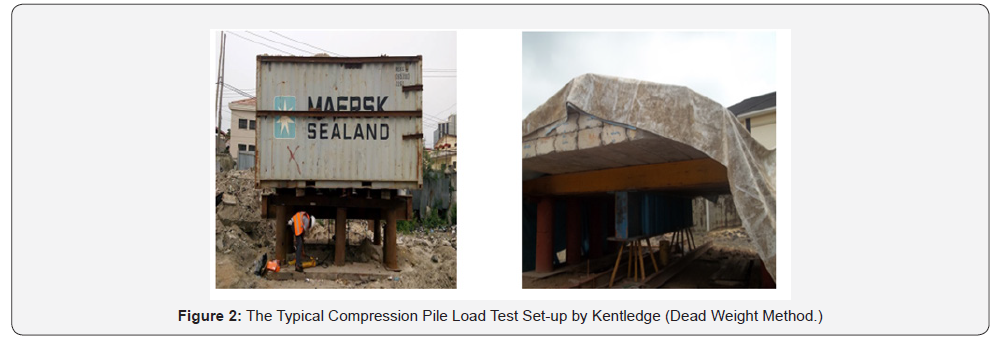
Load transfer is by means of a jack which obtains its reaction from kentledge heavier than the required test load Figure 2.
Pile load test procedure
The pile load test involves the application of the load in stages, with the load at each stage being maintained constant until the resulting settlement of the pile virtually ceases before the application of the next load increment. Maximum load to be applied on a single pile for this method will not exceed 2.0 x safe working load (S. W. L). The load is applied in increments of 25 % of the design load. Each load increment is maintained until the rate of settlement is not greater than 0.05mm/30 minutes or until a maximum of about 2 hours have elapsed, whichever occurs first. The maximum load is maintained on the pile for 6 hours, except in the event that the average rate of settlement is not greater than 0.05mm/30minutes. Unloading of pile is done in decrements of 25 % of the maximum load or as specified by the client
Results and Discussion
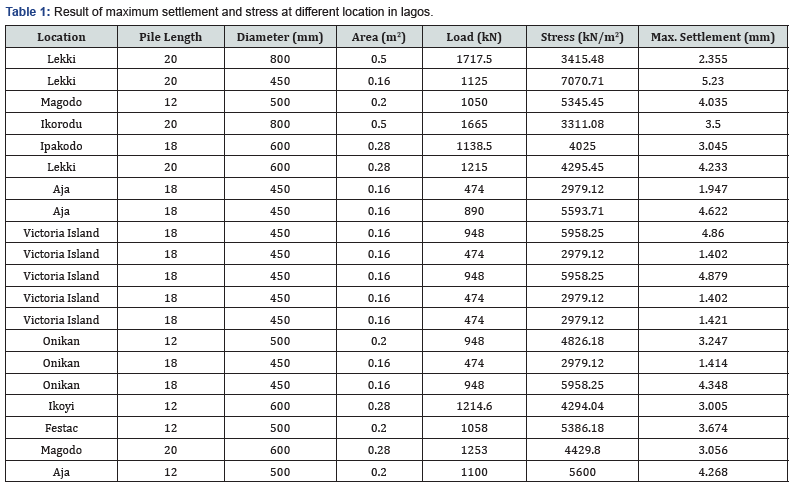
Table 1 consists of raw data obtained from the series of static pile load test (SPLT), which include the test location, length of pile, diameter and area of pile, safe working load, maximum stress and most importantly the maximum settlement. It is observed that Lekki had the highest settlement followed by Aja, Ikoyi, and Victoria Island. The high settlement observed in Lekki is liken to the reclamation of area and in Figure 3, the bar chart depicts the variation of maximum settlement at the various static pile load test locations. In order to obtain the model that predicts the settlement of pile in the coastal region of Nigeria, the following statistical analysis were conducted:

I. Descriptive Analysis
II. Parametric test
III. Pearson’s Correlation Test
IV. Regression Analysis
Descriptive Analysis
This analysis provided an opportunity to assess the variables in terms of the mean, median, mode, standard deviation, variance, range, minimum and maximum value as shown in Table 2. Also, some very useful descriptive statistics, which include the mean, standard deviation and 95 % confidence intervals for the dependent variable (maximum settlement) for each separate group (Lekki, Magodo, Ikorodu, Ipakodo, Aja, V.I, Onikan, Ikoyi, Festac), as well as when all the groups are combined (total) are also presented Table 2.
Parametric Test: The function of this parametric test is to analyze the test group mean of the data.

One-way ANOVA
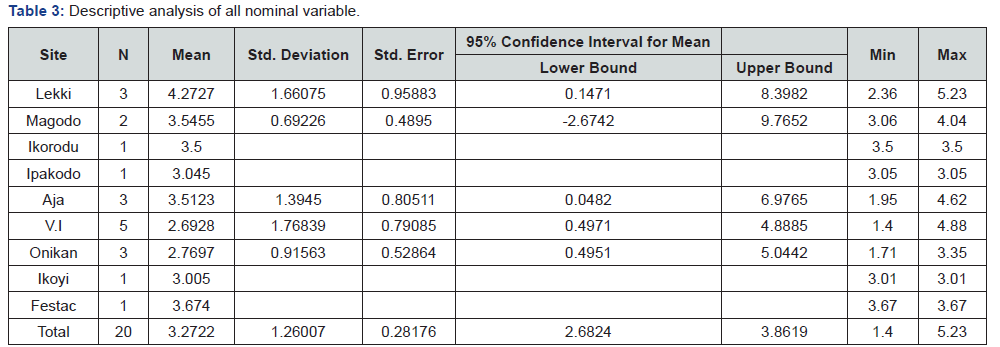
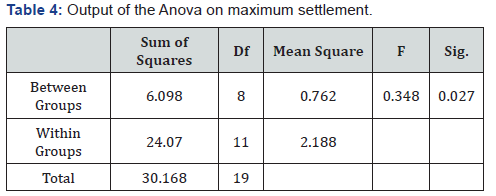
The purpose of this test was to determine whether there were any statistically significant differences between categorical independent variables and a normally distributed interval dependent variable. Table 3 shows the output of the one-way ANOVA analysis on maximum settlement. The output of the ANOVA analysis shows whether there is a statistical difference between the groups of means Table 4. It can be seen that the significant value is 0.027 (i.e., p = 0.027), which is below 0.05. And therefore, there is statistically significant difference in the mean maximum settlement with respect to its location.
Correlation Analysis
The purpose of a correlation analysis is to determine a significant relation between two variables, in this case, it is the relationship between stress and maximum settlement. The Pearson’s correlation test estimates the strength of the linear relationship between the two variables, correlation coefficients range from -1.0 (a perfect negative correlation) to positive 1.0 (a perfect positive correlation). The closer the correlation coefficient get to -1.0 or 1.0, the stronger the correlation. The closer the correlation coefficient get to zero, the weaker the correlations between the two variables. Table 5 shows the result of the Pearson’s correlation test analysis between stress and maximum settlement. It is evident that stress has a strong positive correlation with maximum settlement, which implies that an increase in stress influence increase in maximum settlement. This was indicated by the Pearson correlation coefficient (R) = 0.92 which is positive as indicated by the beta coefficient of the independent variable (stress). In Figure 4, the variation of maximum settlement (mm) with stress is shown and there is a positive relation between the maximum settlement and stress with an R2 regression correlation coefficient of 0.8428. The predictive model is given in equation 1 as follows:
S = 0.0009σ − 0.864 (R2 = 0.8428) (1)


Conclusion
Based on the results of this study, the following conclusions can be drawn:
1) Stress had a strong positive correlation with settlement, this implied that an increase in stress influenced increase in maximum settlement. This was indicated by the Pearson correlation coefficient (R) = 0.92 which was positive as indicated by the beta coefficient of the independent variable (stress). The implication is that as the stress increased, the maximum settlement also increased by 92 %.
2) That Lekki a reclaimed area has the highest settlement followed by Aja, Ikoyi and Victoria Island.
3) A model for predicting the maximum settlement of a pile in the coastal regions of Lagos was formulated in this research as:
S = 0.0009σ − 0.864
Recommendations
Based on the results of this study, it is recommended that the developed predictive model developed may be used in predicting Stress- maximum settlement response of static pile load tests in the coastal regions of Lagos.
For more open access journals, please click on: Juniper Publishers
For more civil Engineering articles, please click on Civil Engineering Research Journal
https://juniperpublishers.com/cerj/CERJ.MS.ID.555738.php


Comments
Post a Comment