Following Status and Percent Followers on Two-Lane Highways: Empirical Investigation- Juniper Publishers
Civil Engineering Research Journal- Juniper Publishers
Introduction
Car following is an important operational phenomenon on two-lane two-way highways where a single lane is provided for each direction of travel. On these highways, faster vehicles catch up with slower vehicles resulting in vehicular platoons where vehicle speeds are restricted by the speed of slow-moving platoon leaders. In the process, a vehicle leaves the free-flow state and enters into the following state. Car following has serious implications on operations and safety. Specifically, the quality of service on two-lane highways is directly related to following other vehicles in the traffic stream and is estimated in the current Highway Capacity Manual (HCM) using percent-time-spent-following (PTSF) which is defined as “the average percent of total travel time that vehicles must travel in platoons behind slower vehicles due to inability to pass on a two-lane highway [1]. In general, car following interactions on two-lane highways are known to be a function of traffic volume in the same direction of travel, opposing traffic volume, percent no-passing zones, and speed variation within the traffic stream in relation to traffic mix. Expectedly, these variables include factors that would primarily determine the amount of passing opportunities and platooning for a specific traffic stream. Besides the quality of service estimation, car following interactions have other important applications in traffic engineering. It is critical in developing car-following theories and algorithms which aim at modelling the car-following behaviour between successive vehicles on the same lane in a traffic stream. Also, the concept is important in developing microscopic traffic simulation models where rules of car-following and lane-changing behaviour are essential parts of any model. Further, it is important for estimating the free-flow speed, an important parameter for many traffic analyses. Percent followers, a surrogate measure for PTSF, has been used extensively for operational analyses of two-lane highways and is defined as the percent of headways less than 3 seconds on a two-lane highway [1].
Introduced in the HCM 2000 Transportation Research Board [1], this measure was developed for field estimation of PTSF using simulation. The measure was incorporated later in other proposed measures, primarily follower density and percent impeded [2,3]. Accurate estimation of the headway threshold used in calculating percent followers is essential for accurate operational analyses on two-lane highways. This paper presents an empirical investigation into car following interaction on two-lane highways and the major parameters that are needed in modelling the car following process.
Background
Car following interaction (or lack thereof) is highly dependent on the proximity of successive vehicles in the traffic stream, typically measured using time headway. While the headway at which vehicular interaction starts is believed to be a stochastic variable and is largely dependent on driver characteristics, a single cut-off value has often been used in practice in identifying vehicles in following mode from those in free-flow mode. A brief overview of studies that utilized headways solely in identifying the following status or percent followers is presented in this section. Different thresholds have been identified by researchers to separate following vehicles from non-following vehicles. Several studies have suggested a headway cut off value between 3 and 4 seconds in identifying vehicles that are in following mode [2-6]. Dijker et al. [7], Shiomi et al. [8]. Dijker et al. [7] proposed a headway cut-off value of 5 seconds for identifying trucks in platoon. Wasielewski [9] investigated drivers’ car following patterns on a single lane of an urban freeway. A semi-Poisson model was applied to a database of 42,000 observed headways. It was found that the followers’ headway distribution is independent from the flow with a mean of 1.32 seconds and a standard deviation of 0.52 second [9].
Lay [10] suggested three distinct states in regard to carfollowing interaction and vehicles’ proximity in the traffic stream. He used 2.5 seconds as a headway threshold for following vehicles, headways between 2.5 and 9 seconds for vehicles that are either in following or free-flow state, and a headway greater than 9 seconds for vehicles in free-flow state.
Bennet et al. [11] investigated critical headways at 58 study sites in New Zealand. Critical headway was defined as “the headway below which a vehicle’s speed is affected by the preceding vehicle”. Different techniques were used to establish the critical headway. Among them, the mean of relative speeds, the mean relative speed ratio and the exponential headway model were identified as the best techniques. Using those techniques, critical headway was found to be in the range of 3 to 4.5 seconds.
Van As [12] investigated the car following behaviour using field data in South Africa. A new methodology was proposed. A vehicle was tracked over a length of highway to check if the following gap changed over the observation distance. If the gap remained constant, it was likely that vehicle was following. The study suggested two criteria for classification of vehicles as followers; following gap shorter than 3 seconds, and speed differential less than 20km/h. The study found an average following headway of 1.2 seconds for light vehicles and 1.8 seconds for heavy vehicles.
Penmetsa et al. [13] studied two-lane intercity highways under mixed traffic conditions in India. The study utilized the clear gap between two consecutive vehicles in analyzing the following status. It was assumed that vehicles traveling in the same lane with a relative speed of 2km/h or less to be in carfollowing mode. Then, the probability of not following was plotted against time gap using the 2km/h rule. The gap corresponding to 50% probability was chosen as the critical gap, which was found to be 2.6 seconds. Al-Kaisy & Durbin [14] investigated vehicular platoons on two-lane highways in Montana. Average travel speed was plotted against individual time headways at several study sites. The results showed that the increase in speeds is more notable at short headways and it diminishes when headways reach a value in the range of 5 to 7 seconds.
Evans & Wasielewski [15] suggested a headway threshold of 2.5 seconds for vehicles in car-following mode on freeways. The value of 2.5 seconds was suggested for traffic flow of less than 1450 vehicles per hour per lane, while 3.5 s was suggested for higher flow levels.
In a study by Vogel [16], the speed, distance headway and time headway data of more than 100,000 vehicles on urban roads in Sweden were analyzed. The study found that the speed of two successive vehicles are linearly dependent on time headway for headways up to 6 seconds. A similar finding has been reported in a few other studies (Al-kaisy & Karjala [17], Lobo et al. [18], Hoogendoorn [19]). Some other studies have reported the use of 5 seconds as the headway cut-off value for identifying free-flowing vehicles in the traffic stream [20-24].
Research Motivation
This study aims at achieving a better understanding of the car-following interaction between vehicles on two-lane twoway highways. Such an understanding is critical for estimating car-following parameters that have been used in practice for identifying vehicles that are in following mode, an important aspect of operational analyses on two -lane highways. Moreover, the knowledge gained from this research is valuable in modelling two-lane two-way traffic operations using microscopic traffic simulation.
Car-Following Process
Car-following behaviour, i.e., the interaction between successive vehicles sharing the same travel lane, has been the focus of research since the early developments in traffic-flow theories. This vehicular interaction becomes especially important on twolane two-way highways where only one lane is available for each direction of travel. On these facilities, car-following interactions become a major determinant of the quality of service and an indicator of the amount of platooning, i.e., the time during which drivers are forced to travel at a speed less than their desired speed due to being impeded by other vehicles in same travel lane. Those interactions are expected to increase with the increase in traffic demand, increase in the percentage of slow-moving vehicles (e.g., trucks), and as more restrictions exist on passing opportunities. It is believed that when the time gap (or headway) between two successive vehicles in the traffic stream gets smaller, the carfollowing interaction would start at some point and is usually reflected by the following vehicle adjusting its speed as it gets closer to the lead vehicle. This introduces an important parameter, referred to here as critical headway (hcr), and is defined as the time headway at which the car-following interaction starts. As the following vehicle continues to approach the lead vehicle, the speed of the following vehicle and the headway between the two vehicles will continue to decrease until a point is reached when the speeds of the two vehicles will be approximately the same. At this point, the headway between the two vehicles represents what is perceived as the minimum safe headway (hmin). In this research, time headway and not gap is used to refer to the physical proximity of successive vehicles in the traffic stream on two-lane highways as it can directly be measured in the field.
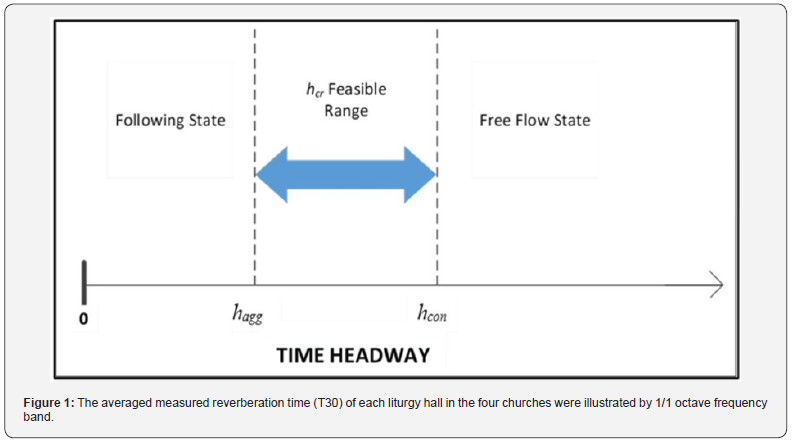
Like many other traffic phenomena, it is rational to assume that both hcr and hmin are stochastic variables that are mainly a function of driver characteristics. An important question this research attempts to answer is how close the following vehicle needs to be from the lead vehicle for this interaction to take effect; or in other words, what is the value of critical headway on twolane highways? It is expected that this headway is primarily a function of the driver of the following vehicle. Specifically, more aggressive drivers may start to interact with the lead vehicle and adjust their speeds when they are very close to the lead vehicle (i.e., very small critical headway, hagg), while on the other hand, more conservative drivers may start to interact with the lead vehicle and adjust their speeds at a relatively large distance from the lead vehicle (i.e., very large critical headway, hcon). In following other vehicles, the majority of drivers start interacting with the lead vehicle at headways that fall between the critical headways for the former two driver types; i.e., the very aggressive and the very conservative drivers.
This concept is shown in Figure 1. This figure clearly demarks the two boundaries: hagg and hcon. Vehicles that travel at headways less than hagg can generally be described as being in following state while those with headways greater than hcon can be described as being independent or in free-flow state. Typical values for the critical headway are expected to be in this range; i.e., between the boundary values hagg and hcon. A similar argument can be assumed for the minimum safe headways (hmin) between successive vehicles in platoons that are in following mode (i.e., not in passing mode) traveling roughly at the same speed as that of the platoon leader. Specifically, the “perceived” minimum safe headway is believed to be a stochastic variable generally varying in a range which represents the more aggressive and the more conservative drivers.
Study Sites
Field data from 15 study sites in Montana, Idaho, and Oregon were used in this study. A few criteria were used for selecting study sites. In the process, an attempt was made, as much as possible, to include sites with a wide range of traffic conditions. Further, study sites were selected to represent uninterrupted flow conditions away from the influence of major driveways or intersections that may have implications on vehicle speeds and headways. Moreover, study sites were selected on tangent segments that are not affected by geometric features such as significant grades and horizontal and vertical curves. All sites are located in rural areas. Data for these sites were provided by the Departments of Transportation in the respective states. Per vehicle data, including arrival time, spot speed, and vehicle classification, were obtained from automatic traffic recorders. Headways were found using the time stamp of successive vehicle arrivals. A description of the data collected at the 15 study sites is provided in Table 1.

Study Results
Investigation of following status on two-lane highways was accomplished using three different analyses. In the first analysis, speeds and headways on two-lane highways were examined graphically in an attempt to identify the range of headways where car-following interactions are expected. This analysis is based on the fact that car-following interactions on two-lane highways often involve adjustment of speed of following vehicles. The second analysis in this investigation involves examination of the minimum safe headway using vehicle speed and headway data. Specifically, it was assumed that at minimum safe headway, the speeds of the lead and following vehicles should be approximately the same. The third analysis in this investigation involves developing a procedure for determining the headway cut-off value used in estimating percent followers; that is, identifying the percentage of vehicles in car-following mode. The proposed procedure is based on the car-following process described earlier and the assumption that the percent followers are directly proportional to the reduction in average speed from that of free-flowing vehicles.
Headway speed investigation
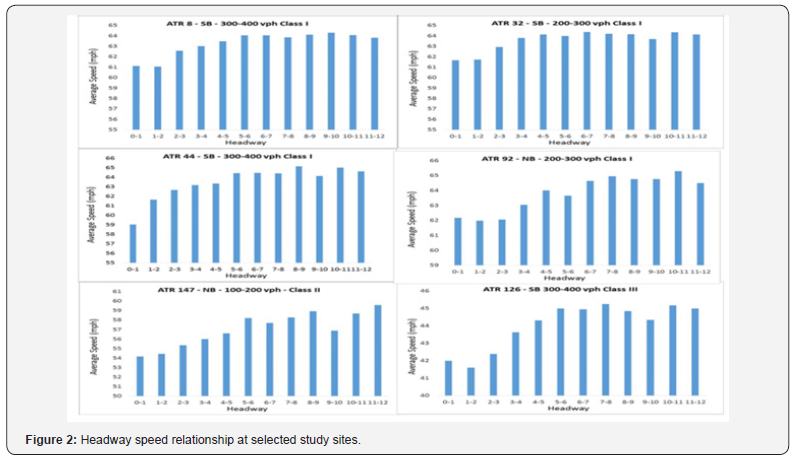
As car-following interaction between successive vehicles on the same lane is usually reflected in speed adjustments, speed data were used in examining the car-following parameters on two-lane highways, particularly the critical headway range and boundary values. Figure 2 shows the average speed for vehicles traveling with different headways at six selected study sites for headway values up to 12 seconds. The general trend exhibited at all study sites affirms that average speed tends to be lower at low headway values (mostly below two seconds, with the exception of site ATR 92 where average speed remains low up to 3 seconds), increases steadily afterwards until headways reach some value that generally fall in the range of 5 to 7 seconds, beyond which average speed would level out reflecting the average speed of free-moving vehicles. However, site-specific trends are slightly inconsistent and fluctuate at times, something expected given the stochastic nature of speed observations.

To gain a better insight into the relationship between headways and speeds, average speed was calculated for headways equal to or greater than a certain headway (h) and plotted at the same selected sites using the same data for headways up to 12 seconds. The results are shown in Figure 3. This figure shows more consistent patterns that are largely similar at the six study sites. For the majority of the sites, average speed starts to increase when the headway exceeds 2 seconds, then continues to increase steadily until it starts to flatten out when headway reaches a value around 6 seconds (with a couple of exceptions: ATR 32 at 5 seconds and ATR 92 at 7 seconds). The general shape of the relationship is an S curve, which is an expected pattern for this relationship.
Minimum safe headway investigation
Another important aspect of the speed-headway investigation is to examine the percentage of headways for vehicles traveling at roughly the same speed. This was deemed to be directly related to the percentage of vehicles in following mode that are maintaining perceived minimum safe headways (hmin). To perform this investigation, the percentage of headways with relative speed between the following and lead vehicles of up to ±1mi/h was determined for headways up to 12 seconds using 1-second intervals. Results of this analysis at site ATR 8 are shown in Table 2. This table shows a consistent pattern regarding pairs of vehicles traveling at the same speed in the traffic stream. Specifically, the table clearly shows that headways associated with “same speed” vehicles increase as relative speed increases and decrease with the increase in headway value. Accounting for inaccuracies in detector speed measurements and the minimal differences in speeds of following (platooned) vehicles, speeds of up to ±1mi/h was considered as “same speed” in this analysis. For headways less than two seconds, the percentage of headways with relative speed of ±1mi/h is more than 40%, which is relatively high given that each headway is associated with two vehicles in the traffic stream and therefore the percentage of “same speed” vehicles is expected to be higher than that of “same speed” headways (generally a function of platoon size). Other vehicles in this headway range with relative speeds greater than ±1mi/h might be in the process of performing a passing maneuver, have not yet reached the minimum safe headway, or are simply just outside the cut-off value of ±1mi/h. It is important to note that even at headway values where free-flow conditions are believed to exist (e.g., headways greater than 10 seconds), a certain percentage of vehicles still travel at the same speed which is expected given the tendency of speed observations to concentrate around the mean value.

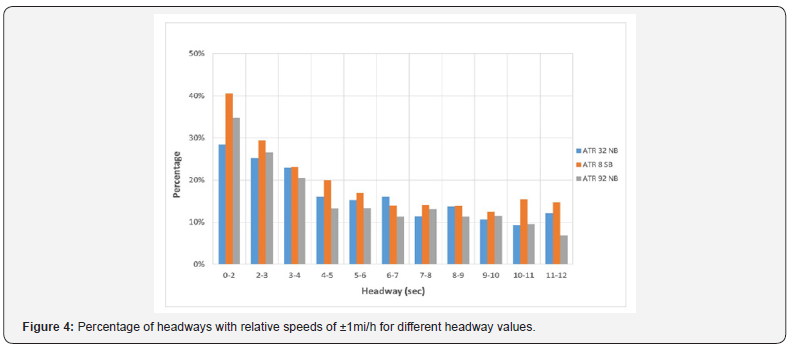
Figure 4 shows the percentage of headways with relative speeds of ±1mi/h for different headway values at three two-lane highway sites, ATR 8, ATR 32, and ATR 92. This figure shows a consistent trend in the change in percent of “same speed” headways with the increase in headway at the three study sites.
Estimating percent followers using speed data
In this research, the speed data were further analyzed in an attempt to achieve a better estimation of vehicles that are in carfollowing mode. This estimation is very important as it has been used in practice in determining percent followers, a surrogate measure for percent-time-spent-following, which is a major performance measure for two-lane highways.
The approach followed in this research is based on the premise that average speed and car following status are directly related. It was shown in the previous section that almost all vehicles with headways less than hagg are in car following mode and almost all vehicles with headways greater than hcon are in free-flow mode. In the range between hagg and hcon, some vehicles are in carfollowing mode while others are in free-flow mode. In this range, assuming that the percentage of following (platooned) vehicles is linearly proportional to the difference between average speed of following vehicles and that of the specific headway bin, the proportion of platooned (following vehicles) in each headway bin can be estimated. Knowing the frequency of headways in each bin, the number of followers can be estimated. Using a headway cutoff value for determining percent followers requires the number of following vehicles in the transition range (range between hagg and hcon) to be equivalent to the number of all vehicles in the range with headways smaller than the cut-off value.
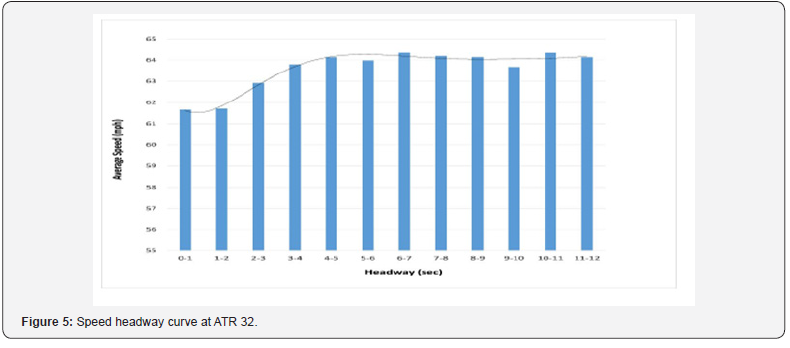
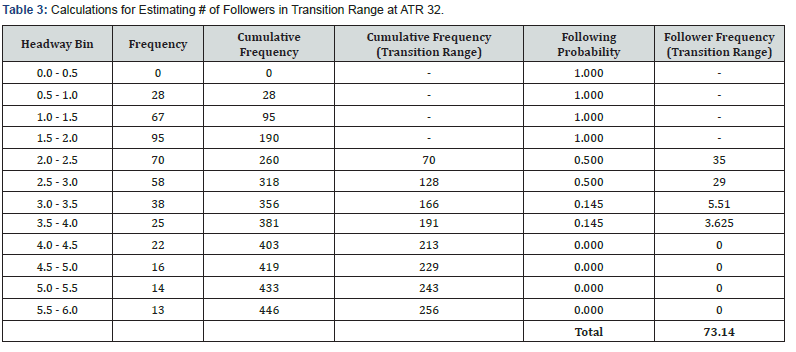
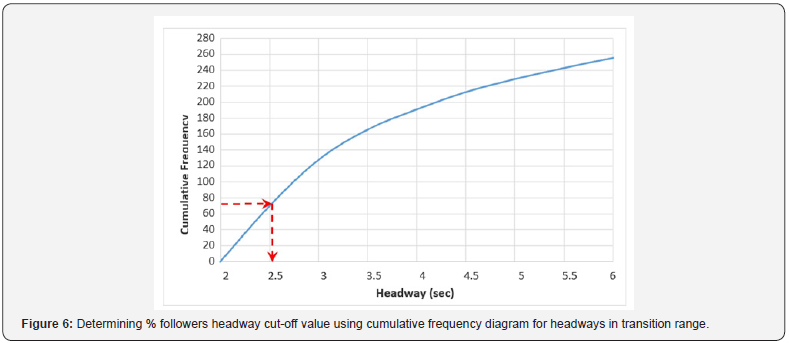
The above proposed approach was applied to field data collected at the fifteen two-lane study sites. At each site, the speed-headway relationship is established along with the values of hagg, hcon, average speed of following vehicles, and average speed of free-moving vehicles. Using ATR 32 as an example, these values are 2 seconds, 6 seconds, 61.7mi/h, and 64.1mi/h, respectively as shown in Figure 5. Assuming average speed in the transition range is directly proportional to percent followers, the frequencies of followers in this range can be determined, and calculations for ATR 32 are summarized in Table 3. Establishing the headway cumulative frequency diagram in the transition range and entering the chart with the total number of followers in transition range found in the last column of Table 3 results in a headway cut-off value for calculating percent followers at this site (Figure 5).
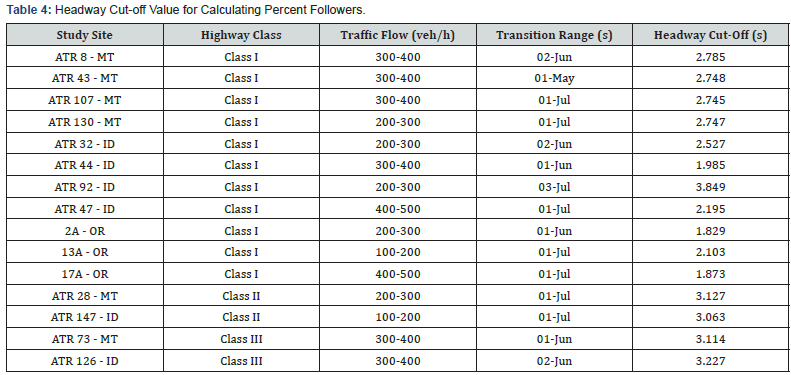
The approach described above was applied to all fifteen study sites and the results are summarized in Table 4. For class I highways, the estimated headway cut-off for percent followers varied between 1.8 and 2.8 seconds with the exception of ATR 92 where the cut-off value is much higher (3.845 seconds). Examining the transition range at this site and the relationships shown in Figure 2 reveals that average speed remained insensitive to headway up to 3 seconds, something unexpected and atypical on rural two-lane highways. For class II and class III sites, the cutoff values were all slightly above 3 seconds. Average operating speeds at those sites are generally lower than those at class I sites, which may be related to car following headway parameters being different from those sites on higher speed class I facilities (Figure 6).
Conclusion
This paper presents an empirical investigation into the carfollowing interaction and the estimation of percent followers on rural two-lane highways. Field data from 15 study sites in Idaho, Montana and Oregon were used in this investigation. The most important findings of this study are summarized as follows:
A. Results from the speed-headway investigation suggest that the critical headway (hcr) varies approximately in the range between a lower limit of 1 to 2 seconds and an upper limit of 6 to 7 seconds, with the majority of sites having a range between 1 and 7 seconds.
B. Vehicles traveling at perceived minimum safe headways increase in number as headways get smaller. While pairs of vehicles in free-flow state may still travel at the same speed, the percentage of these vehicles increases steadily as more vehicles enter into the following state.
C. Results from the analysis for determining percent follower headway cut-off value suggest that for class I highway, this value is likely to fall in the range of 1.8 and 2.8 seconds, lower than the current value used by HCM of 3 seconds. For class II and III sites, results suggest values that are slightly higher than 3 seconds.
Further research is needed using data from more study sites, particularly on class II and class III highways, to affirm the findings of this study and gain additional insights into car-following parameters on rural two-lane highways. Moreover, other variables that may have an effect on the car following process such as traffic level and light condition were not investigated in this study.
Acknowledgement
The authors would like to acknowledge the financial support provided for this study by the National Cooperative Highway Research Program. Further, the authors would like to thank the respective staff at the state Departments of Transportation for providing the data used in this study.
For more open access journals, please click on: JuniperPublishers
For more civil Engineering articles, please click on Civil Engineering Research Journal
https://juniperpublishers.com/cerj/CERJ.MS.ID.555711.php


Comments
Post a Comment