Assessment of Different Intersection Designs to Accommodate Left Turns Through Indirect Maneuvers- Juniper Publishers
Civil Engineering Research Journal- Juniper Publishers
Abstract
Although there are studies that compared between indirect left-turn treatments such Median U-turn (MUT) or RCUT to the Conventional Intersection (CI) designs, very few have compared between the operational performances of MUT versus RCUT. Furthermore, few studies on the Quadrant Roadway Intersection (QRI) were found in the literature. The main objective of this paper is to assess different designs for the accommodation of left turns through indirect maneuvers. Traffic performance of the proposed intersection designs was evaluated based on microsimulation. The results revealed that the difference between the two designs, RCUT and MUT lies in the amount of traffic rerouted to the crossover intersections. Increasing the traffic downstream of the main intersection to the crossover intersection still has an effect on the main intersection’s operations. Proper design and spacing is needed at the crossover intersection to mitigate this effect. The analysis also showed that at higher volume levels, RCUT throughput becomes restricted compared to the MUT which was attributed to the left turn effect at the main intersection. However, the RCUT showed 52% improvement over the MUT in average speeds.
RCUT also showed 66% over MUT in delay savings and one-year cost reductions when compared to the conventional intersection at 200% volume level. The assessment of the Quadrant Roadway Intersection (QRI) design revealed 12% increase in throughput compared to the CI when CI reaches capacity with 48% increase in speeds and 66% reduction in delay. The cost of the connector roadway is the greatest cost and affects the total project cost depending on the available right of way. Some of the costs associated with the QRIs could be slightly compensated by the reduced widths at the main street intersection. Overall, QRI is significantly cheaper than the grade separation alternative.
Abbreviation: FDOT: Florida Department of Transportation; TSM&O: Transportation Systems Management & Operations; MUT: Median U-Turn; RCUT: Restricted Crossing U-Turn; QRI; Quadrant Roadway Intersection
Introduction
With increasing traffic and limited resources, the Florida Department of Transportation (FDOT) moves forward with a vision of optimizing intersection control through the implementation of innovative intersection designs through the Transportation Systems Management & Operations (TSM&O) program [1]. An alternative treatment that completely removes left turns at the intersection is the Median U-turn (MUT) [2]. MUT is an unconventional intersection alternative that helps reduce the number of signal phases and consequently the delay while at the same time improves the intersection traffic capacity. This technique has been utilized frequently in Michigan and is also known as Michigan U-turn. Hummer [3] analyzed the MUT intersection and concluded that the MUT alternative may be utilized when there are high through arterial volumes, median, high left-turn volumes, and where the cross-street through volumes are insignificant.
Hummer & Reid [4] provided an update to evaluate the capacity and efficiency of the MUT. The study concluded that the MUT may increase intersection capacity due to the reduction of signal phasing, but on the other hand it may decrease the capacity because of the vehicles using the crossover pass through the intersection more than once. The capacity may be also decreased due to the lack of approach lanes available. Another version of the median U-turn is the Restricted Crossing U-Turn (RCUT). Inman & Haas [5] studied the operations, safety and performance of RCUT intersections. Nine RCUT intersections were analyzed in Maryland and compared to the conventional intersections. Crash analysis was one of the variables analyzed; comparing the crash rate before and after the RCUT intersection was implemented. Results showed that although this method may add a little bit of travel time to the left turn users, it eliminates accidents and is consequently increasing the overall safety of the intersection.
The Quadrant Roadway Intersection (QRI) is another unconventional intersection design that may effectively accommodate high traffic volumes while eliminating the conventional left turns at the main intersection. Reid [6] studied the operations, design, advantages and disadvantages of the QRI method. The QRI uses an additional roadway to eliminate direct left turns from the main road at one quadrant of the intersection. The roadway should have at least three lanes to work efficiently and facilitate left turns. There is no specific quadrant that must be chosen, any of the four quadrants on the intersection would work properly. All the left turns on the main intersection are rerouted to the quadrant roadway. Safety has been a significant concern in conventional intersections with high turning volumes; QRI designs improve safety at these locations. The main objective of this paper is the assessment of three different designs for the accommodation of left turns through indirect maneuvers which were recently proposed in Florida in order to test the concept. MUT, RCUT and QRI are still new in Florida and majority of the local public agencies are still reluctant to implement those new concepts. Each location has different challenges in terms of traffic operations that need to be addressed.
Case 1: U-Turn Intersection Alternatives
The case study for the proposed U-turn intersection alternatives was conducted for the intersection of US 27 and Hartwood Marsh Road located in Clermont, Florida. This intersection was selected for the case study for couple of reasons. First, the intersection experience heavy traffic volumes on both the mainline and Side Street resulting in heavy congestion in the peak hours. Second, the mainline has a wide median suitable for the Median U-turn and is operated with high speed. So, this analysis was performed seeking a possible alternative of the existing intersection in order to minimize the delay and congestion for better traffic operations. The intersection is 4-legged with Hartwood Marsh Road running east-west while US27 running north-south. Hartwood Marsh Road is a 2-lane undivided roadway east of US27 with posted speed limit of 40mph, and it continues as 2-lane road as Vista Del Lago Blvd with posted speed limit of 25mph west of US 27. US 27 is a six-lane divided principal arterial both south and north of Hartwood Marsh Road with posted speed limit of 55mph. The east approach has one exclusive left-turn lane with storage length of about 550 feet, one through lane, and one exclusive right-turn lane with storage length of approximately 150 feet, whereas west approach consists of one exclusive left-turn lane with storage length of about 150 feet and one shared through- right-turn lane. On the other hand, the north and south approaches consist of one exclusive left-turn lane, three through lanes and one exclusive right-turn lane. The storage length of right-turn and left-turn lanes of the north and south approaches ranges from 400 to 550 feet.
Case 1: Vissim Models
Performance of the proposed MUT and RCUT intersections was evaluated based on VISSIM 9 software. VISSIM incorporated all the necessary traffic characteristics in order to replicate the existing scenario. The evaluation involved existing conventional intersection (CI), MUT, and RCUT intersections. So, three separate VISSIM models were developed. Geometric designs of the MUT and RCUT intersections were developed based on the FHWA’s median U-turn informational guide [7]. The model development process started with coding the network geometry of the existing intersection including number of lanes in each movement, storage lengths, roadway width, lane usage and width of the median. Traffic volume in each direction and in each movement was entered including its respective vehicle composition. Then, traffic signals and their corresponding signal timing plan were imported in the model. Actual signal timing data was received from the County and used for the conventional intersection. However, Synchro software was used to optimize the signal timing for the MUT and RCUT intersections. Detectors were also placed right before stop bar in each approach. Lastly, appropriate priority rules were applied at the necessary conflicting areas. Snapshot of VISSIM model for CI, MUT and RCUT intersections are shown in Error! Reference source not found.
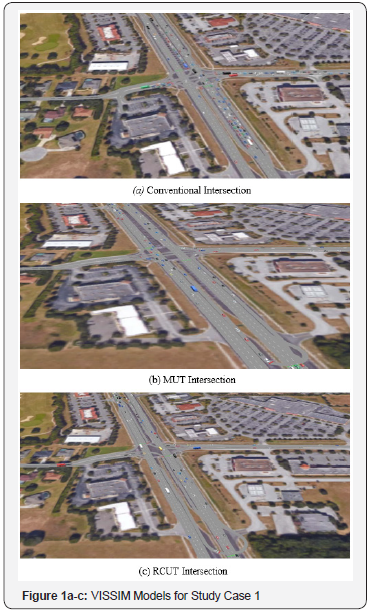
In order to confirm that the model reflected the actual traffic characteristics and geometric condition, the model was calibrated and validated using field data including traffic counts, delay and queue lengths. Peak hour traffic counts were used in the validation that was extracted from the video file for the study intersection recorded on March 24, 2015. To evaluate the operational performance of the three intersection configurations (CI, MUT, and RCUT), six levels of intersection traffic volumes were studied that varied from 100% (existing volume) to 200% with 20% increment in each level. Therefore, a total of 18 experiments (scenarios) were performed and evaluated. Each experiment was simulated for 60 minutes. A total of ten runs with different seeding values were completed for each scenario and the average of the 10 runs was reported for the analysis. Synchro software was used to estimate the optimum traffic signal cycle length and splits for each scenario. Several trials for different signal timing plans were tested in VISSIM to find out the best signal timings based on the overall network performance (Figure 1a-c).
Case 1: Results and Analysis
CI and MUT
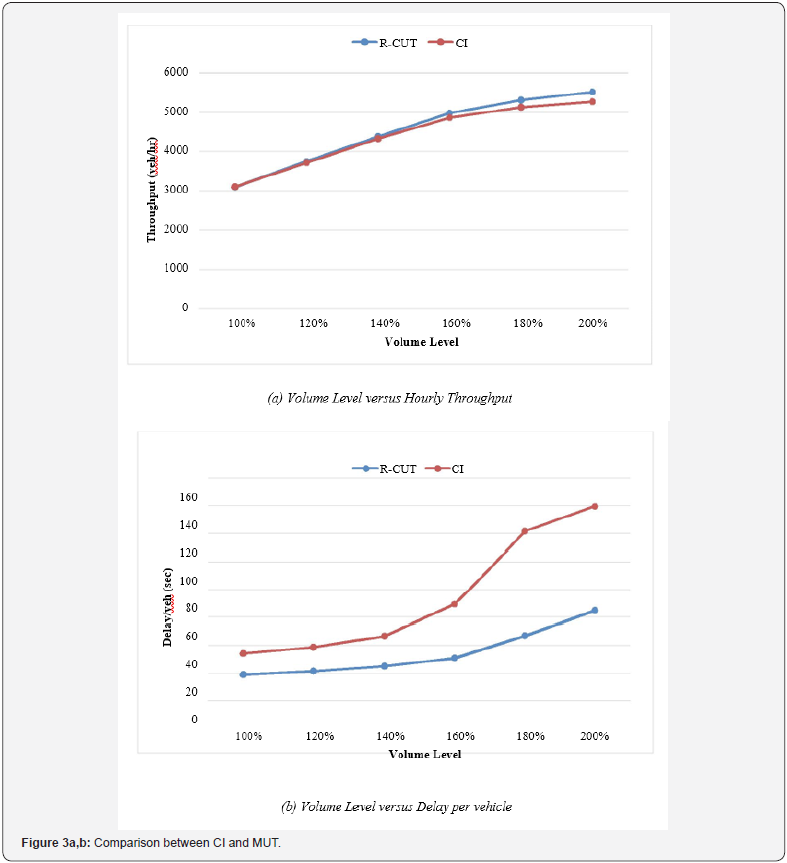
The comparison between the existing conventional design and the MUT proposed design was performed based on the simulation results obtained from VISSIM output for each scenario. A comparison of the hourly throughput volumes between CI and MUT at each volume level is illustrated in Error! Reference source not found Figure 2a. The MUT intersection throughput outperformed the CI throughput starting from the 140% volume level, which is an indication of the limited capacity of the CI. The change in hourly throughput volume between the CI and MUT ranged from about 3% to 8%. Trend of delay per vehicle for each volume level was also plotted between MUT and CI as shown in Error! Reference source not found Figure 2b. The difference in overall delay could be seen in each volume level but it was maximized at 180% volume level at which CI reached its capacity. The overall travel time also followed the same pattern as delay and showed improvement for MUT up to 37%. Level of service was also improved in each volume level. Based on the results, it can be concluded that MUT intersection design considerably enhanced the overall operation and capacity over CI. The throughput volume was observed significantly less than the input volume around 180% for conventional intersection and around 200% for RCUT intersection, which is an indication of capacity constraint of the conventional intersection.

CI and RCUT
Error! Reference source not found Figure 3a demonstrates the hourly throughput volume for CI and RCUT for each volume levels. The throughput volume increased for RCUT compared to CI, although the change was not very large (up to 5%). Error! Reference source not found. showed the relationship between delay per vehicle and volume level for CI and RCUT. The difference in overall delay was observed in each volume level but the highest was observed at 180% volume level as shown in Error! Reference source not found Figure 3b. As mentioned earlier, the capacity was reached for CI at around 180% volume level that produced the maximum difference in delay between CI and RCUT intersection. The overall travel time also followed the same pattern as delay and showed improvement for RCUT up to 40%. Level of service and average speed was also improved in each volume level. RCUT design outperformed CI in each measure of performance for the overall network (Figure 2ab & Figure 3ab).
MUT versus RCUT Intersections
Table 1 represents the overall network performance in terms of hourly throughput volume, delay per vehicle in seconds, level of service, average speed, and total travel time. RCUT was slightly superior to MUT design on the basis of operational performance. The overall delay in each volume level is reduced for RCUT compared to MUT intersection. RCUT also improved average speed and total travel time. The results showed that the RCUT design provided 25% improvement in average speeds at the low volume level and as the volume increases, more benefits were seen reaching up to 75% improvement in average speeds. However, there is a slight reduction in the throughput (up to 5%) as the demand increases in the RCUT compared to the MUT. This may be attributed to the fact that the main line left turn traffic is still utilizing the main intersection and as the left turn increases, the conflict with the opposing thru increases affecting the green time at the main intersection, which in turn affects the throughput when compared to the MUT design. Certain approaches with high volume played the role for better performance of RCUT over MUT. The operation of left-turns at major road and through movement at minor road differed in MUT and RCUT. NBL and SBL in MUT design required to use U-turn crossover while EBT and WBT in RCUT design required using U-turn crossover.
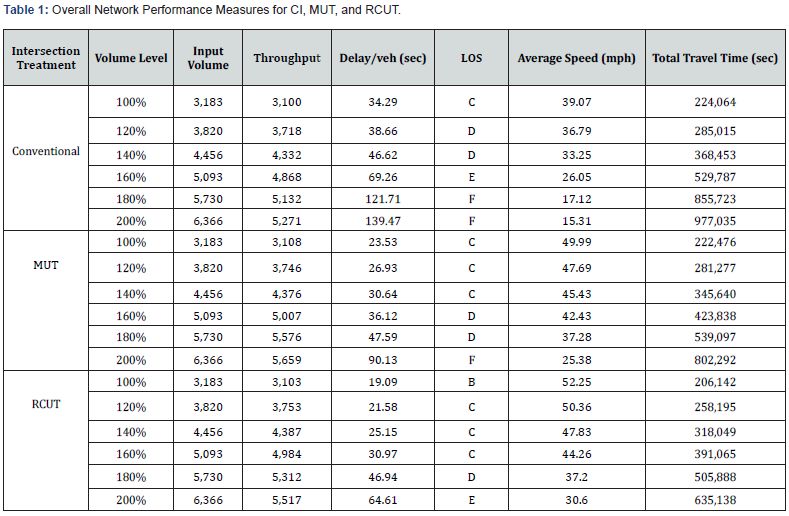
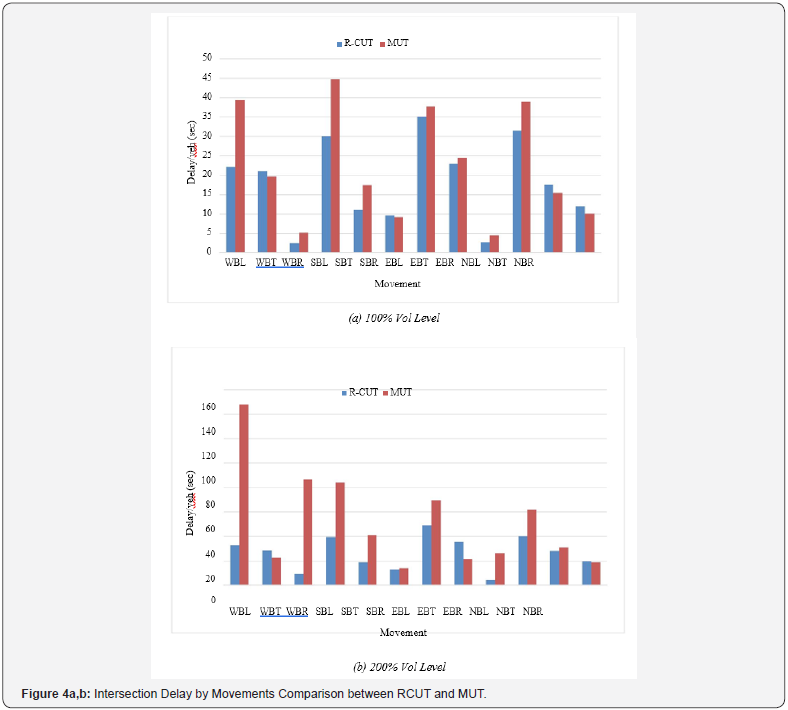
Figure 4 shows the comparison of delay by movements between RCUT and MUT for 100% and 200% volume level respectively. The major difference in delay was observed for WBL and SBL movement. In the study intersection, the volume of the WBT and EBT movements were comparatively less in comparison to SBL and NBL movement. In addition, the NBL volume was very light compared to SBL that increased the green time proportion in SBT direction in RCUT design. According to the design, WBL goes through SBT movement, which showed the advantage of RCUT over MUT for that particular movement of the study intersection. On the other hand, direct through movement of WBT and EBT traffic in MUT intersection was the main benefit over RCUT. However, the volume in WBT and EBT movement was considerably lower compared to SBL and WBL movement. Therefore, the improved operations of WBL, SBT and SBL movements in the RCUT design showed that RCUT was a better alternative than MUT for the study intersection. The analysis also revealed that improvement in the throughput in the MUT and RCUT compared to the CI was observed at the 160% volume level. However, delay improvement was observed at the 140% for RCUT while 160% in the MUT. The results indicate that increasing the traffic downstream of the main intersection to the crossover intersection still has an effect on the main intersection’s operations. The difference between the two designs, RCUT and MUT is the amount of traffic rerouted to the crossover intersections. Proper design is needed at the crossover intersection to reduce its effect on the main intersection. Although the MUT showed slightly higher throughput compared to the RCUT in the range of 5%, the RCUT showed 52% improvement over the MUT in average speeds.
Benefit to time saving
Generally, MUT had moderate benefit-to-cost ratio when compared to the conventional intersection. The cost of converting a conventional intersection to an MUT intersection varies depending on the specific project context. The cost of MUT intersection depends on several aspects such as the number and length of additional lanes required, utility impacts, modifications to the existing signal system, amount of additional right of way, and access modifications. The right of way cost may change by geographical location. For the study intersection, delay savings by MUT and RCUT intersection compared to conventional intersection was calculated as shown in Table 2. The cost of delay of $17.67/hr. was used as reported by Texas A&M Transportation Institute for year 2014.

Case 2: Qri Design
The main objective of this case study is the assessment of Quadrant Roadway Intersection (QRI) to reduce traffic delays at congested 4-leg signalized intersections. The intersection under study is located in Orlando, Florida along Dean Road at University Boulevard. The intersection is 4-legged with Dean Road running in the north-south direction while University Boulevard running east-west. Dean Road is a 4-lane divided road south of University Boulevard and 2-lane divided road north of University Boulevard with posted speed limit of 45mph. Similarly, University Boulevard is operated as a 6-lane divided road in both east and west direction with speed limit of 45mph. This is the main road leading into the University of Central Florida, the second largest university in the Country in terms of student enrollment. The intersection experience heavy traffic in the PM peak hour both on the main line through and left turn as well as the crossing road (Dean Road). Dean Road has two exclusive left-turn lanes, and two through lanes one of them shared with right turn on south approach, and it has two exclusive left-turn lanes, two through lanes, and one exclusive right-turn lane on north approach. University Boulevard has two exclusive left-turn lanes and three through lanes one of which is shared with right turn on east approach, while it has two exclusive left-turns, three through lanes and one exclusive right turn lane on the west approach. The storage lengths in all approaches ranges from 300 to 400 feet except on west approach which is extended all the way to SR 417 north exit on University Boulevard. All the left-turn movements operate with protected phases only and right-turn movements should yield to the conflicting movements. This intersection is considered appropriate for Quadrant Roadway Intersection (QRI) design because it is experiencing recurring congestion in the PM peak hours. The through traffic in east-west direction is heavy and other movements including all left-turn movement, has moderate traffic. In addition, there is an existing roadway in the southeast quadrant where the quadrant roadway as in Quadrant Roadway Intersection design could be operated. Therefore, a QRI design was evaluated as the build scenario and compared to Conventional Intersection (CI) in search of a rational alternative to minimize the intersection congestion especially for future conditions.
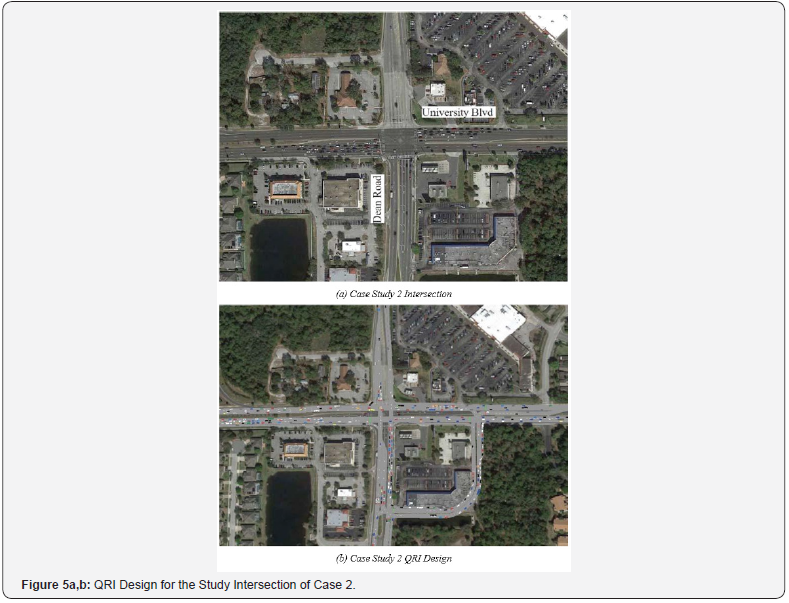
For the study intersection, 4-lane one-connecting roadway quadrant located at the southeast quadrant of the intersection was designed for the evaluation. There was an existing quadrant road where the new roadway quadrant can be constructed. However, a wider 4-lane quadrant roadway connector was designed as shown in Figure 5. Therefore, the additional right-ofway for the wider roadway is needed for the study intersection. The QRI design has three signal-controlled intersections, which included the main intersection, reduced to a two-phase signal and two new T-intersections with three-phase signals at the ends of the quadrant road.
Case 2: VISSIM Modeling
The comparison of operational performance between QRI and conventional intersection was made using results from VISSIM traffic microsimulation software. The VISSIM model was drawn over the properly scaled background picture of the study intersection obtained from Google Map. Number of lanes in each movement, storage length and other geometric features were set up same as the study intersection. Then, traffic volumes and signal timing data were assigned in each movement group. Actual signal timing data was obtained from Orange County. The VISSIM model was calibrated and validated using the field data collected for the study intersection. For the analysis, comparison between CI and QRI was performed in different volume level scenario. Based on the existing traffic volume demand, five volume levels, increasing 10% volume in each volume level, were set up. Therefore, the final experiment resulted in 5*2=10 multilevel factorial. For each volume level, an optimized signal timing plan was used. Synchro was not the best for the signal optimization, but it gave an estimate for the optimized cycle length and splits. Therefore, many trials for different signal timing plans were tested in VISSIM to figure out the best signal timings based on the overall network performance. Additionally, each experiment was simulated for 60 minutes. A total of 10 runs with different seeding values were completed for each scenario and the average of the runs was reported.
Case 2: Results and Analysis
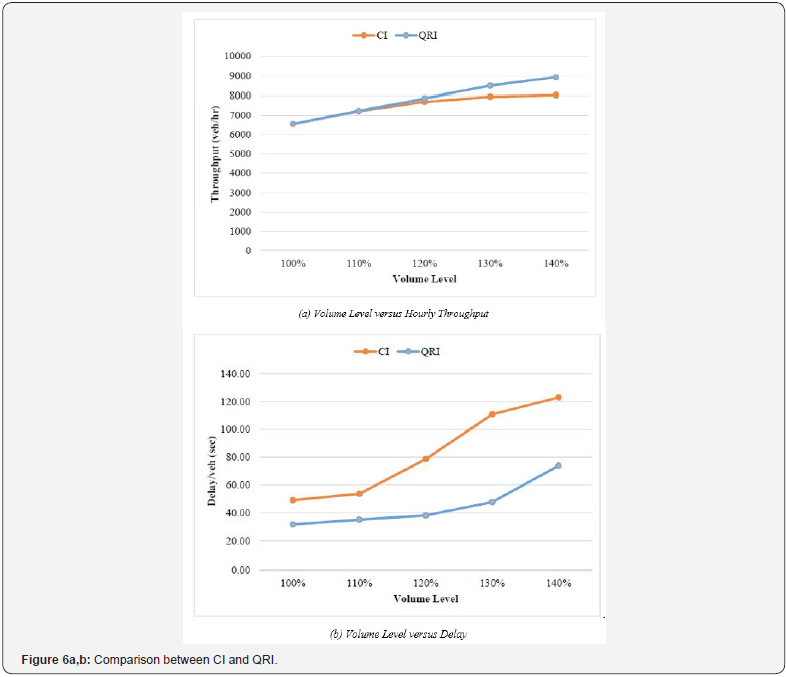
The overall network performance of CI and QRI at each volume level is presented in Table 3. The overall network performance measures included hourly input volume, hourly throughput volume, delay per vehicle, level of service, and average speed. The throughput volume for CI differed from input volume significantly around 120% to 130% volume level, which indicated the capacity of the existing intersection. Comparison can be made based on the overall performance results when the conventional intersection is changed to QRI design as showed in Figure 6. The difference in throughput volume between CI and QRI was obvious past volume level of 120%. Improvement in delay was observed past the 110% volume level. QRI showed delay savings in each volume level ranging from 35 to 57% with the highest value at 130% volume level when compared to CI. When comparing the input and the throughput percentages between the CI and QRI at the 140% volume level, 95% of the input was processed for the QRI, while 85% only from the CI. This result indicates that QRI throughput is 12% more than the CI when CI reaches capacity.
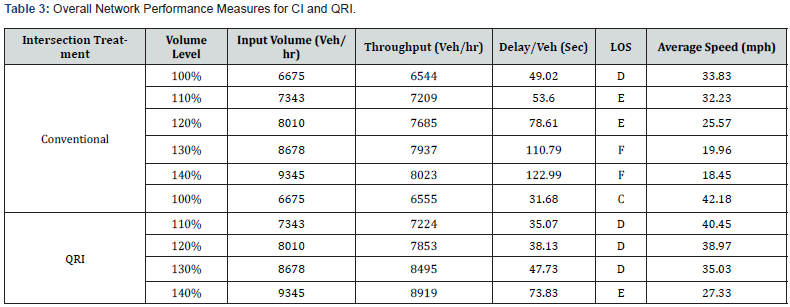
Additionally, QRI also improved the level of service and average speed in each volume level. Average speeds increased by 48% translating into 66% reduction in delay. Therefore, it can be concluded that QRI can enhance the capacity and improve the overall network performance in the study intersection. The operational performance measure by movement was also compared between CI and QRI. At 100% volume level, the delay was improved in all movement except one movement (EBR). Similarly, level of service and travel time also improved in most of the approaches. The QRI design in the study intersection had some indirect left-turn movements such as EBL, NBL, and SBL, which required to travel longer distance and going through multiple signalized intersections.
Benefit to time saving
Construction costs for QRIs are likely higher than a conventional intersection. However, QRI produces moderate to high benefits over conventional intersection. Main components that are needed and add to the cost include the connector roadway, additional signals and overhead signs for the two extra intersections. On average, the connector roadway is about 880 feet (centerline to centerline), or 0.167 miles with 500 feet spacing between the main and secondary intersections. The average right of way is about 1.1 acres. Other costs are related to lighting, maintenance costs and enforcement needs especially during the first months of operations. The cost of the connector roadway is the greatest cost and affects the total project cost depending on the available right of way. Some of the costs associated with the QRIs could be slightly compensated by the reduced widths at the main street intersection. The right of way cost may change based on the geographical location of the intersection.
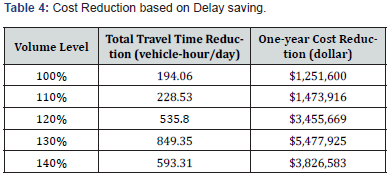
For the study intersection, the existing road located in southeast quadrant of the main intersection was used as a connector roadway. Therefore, project costs related to land acquisition for the connector roadway will be reduced. However, there will be some right of way cost for widening to four lanes to accommodate the left turn traffic volume. Delay savings by QRI compared to conventional intersection was calculated. Table 4 shows the benefit of QRI over CI in terms of delay savings in one year.
Conclusion
This study underlined the important aspects of MUT intersection operation and showed the improvement in operational performance in case of MUT compared to the existing condition. MUT design significantly reduces the number of conflicts at the main intersection, which offers a better operation and safety for motor vehicles, pedestrians, and bicyclists. The two phase signal timing plan provides higher percentage of green time for through movements that ensures a better through operation. However, the left-turn movements may experience higher delay and travel time due to their indirect left-turn movement through U-turn crossover. The analysis highlighted several important aspects regarding RCUT traffic operations and demonstrated how RCUT can improve the overall performance compared to the existing condition. RCUT intersection reroutes through and leftturn movements from the minor streets to the median U-turn crossover, providing an easier maneuver at the major street. RCUT intersection design significantly reduces the number of conflicts at the main intersection, leading to a more efficient and safer operation. Only two phases are required at the main intersection to accommodate the vehicles and pedestrians, which ensures a better operation at the major street. However, the movements at the minor road may experience higher delay and travel time due to their indirect movement using U-turn crossover. Vehiclepedestrian conflicts are reduced significantly through the use of a “Z” shaped crossing in RCUT intersection although it may increase the crossing time a little bit.
The results showed that the RCUT design provided 25% improvement in average speeds at the low volume level and 75% in the higher level. However, there is a slight reduction in the throughput (up to 5%) as the demand increases in the RCUT compared to the MUT. This may be attributed to the fact that volume increase in the left turns as well as the through traffic at the main intersection increases the conflict with the opposing thru resulting in reduced green time affecting the throughput. However, overall speeds and delays outperformed the MUT due to the rerouting of all lefts and side street traffic to the crossover intersection. The case study also showed that RCUT design for this location is better than the MUT design since it reduced the overall delay and travel time and improved the level of service compared to the conventional intersection. The RCUT design outperformed the conventional intersection and the MUT in terms of delay and travel time for increased volume scenario as well. Overall, RCUT intersection was the selected alternative for this location.
The analysis also highlighted several important aspects regarding QRI traffic operations and demonstrated how QRI can improve the overall performance compared to the existing conditions. QRI is applicable mainly for intersections with two busy sub-urban or urban roadways. QRI reroutes all four leftturn movements in a four-legged intersection using a secondary roadway connecting two intersecting roadways. Only two phases are required at the main intersection to accommodate the vehicles and pedestrians, which allocates higher percentage of green time for through movements. QRI throughput is 12% more than the CI when CI reaches capacity. Additionally, QRI also improved the level of service and average speed in each volume level. Average speeds increased by 48% translating into 66% reduction in delay Therefore, it can be concluded that QRI can enhance the capacity and improve the overall network performance at the study intersection which is a cheaper solution than the grade separation alternative. Elimination of left-turn lanes at main intersection provides a shorter crossing distance for pedestrians and bicyclists. Pedestrians and bicyclists get less waiting time due to the shorter cycle length at QRI. Wayfinding is very important at QRI especially for left-turning drivers who are not familiar with the intersection. QRI intersections can provide a superior alternative to heavily congested conventional intersections in terms of overall operational performance.
Acknowledgments
The work reported in this paper is part of a research project under contract BDV24 977-09 which is sponsored by the Florida Department of Transportation (FDOT). The views expressed in this paper do not necessarily reflect those of the sponsors. The authors would like to thank FDOT for their support.
References
- Abou-Senna H, Radwan E, Tabares S, Wu J, Chalise S (2015) Evaluating Transportation Systems Management & Operations (TSM&O) Benefits to Alternative Intersection Treatments, Final Report.
- Bared JG, Kaisar EI (2002) Median U-Turn Design as an Alternative Treatment for Left Turns at Signalized Intersections. ITE Journal 72(2): 50-54.
- Hummer JE (1998) Unconventional Left-Turn Alternatives for Urban and Suburban Arterials-Part One. ITE Journal 1: 26-29.
- Hummer JE, Reid JD (2000) Unconventional Left-Turn Alternatives for Urban and Suburban Arterials. An Update. Transportation Research Circular, Washington, USA, p. 1-17.
- Inman VW, Haas RP (2012) Field Evaluation of a Restricted Crossing U-Turn Intersection. (FHWA Publication FHWA-HRT-11-067). Federal Highway Administration FHWA, Washington, USA, pp. 1-52.
- Reid JD (2000) Using Quadrant Roadways to Improve Arterial Intersection Operations, ITE Journal 70(6): 43-45.
- Reid J, Sutherland L, Brinckerhoff P, Ray B, Daleiden A (2014) Median U-Turn Informational Guide (FHWA Publication FHWA-SA-14-069). US Department of Transportation, Federal Highway Administration Office of Safety, 1200 New Jersey Ave SE, Washington, DC, USA, p. 148.
For more civil engineering articles, please click on Civil Engineering Research Journal


Comments
Post a Comment