Effect of and Salinity Atthe Urban area and its Identification by using Remote Sensing & GIS Technique. A Case Study of Haryana, India- Juniper Publishers
Juniper Publishers- Journal of Civil Engineering

Introduction
The declination of the water table is one of the
major problems of the world. It has been observed in most of developing
countries that the annual water table is declining due to excess use in
agriculture and climate change [1],
but in few part of the world, the problem of rising in water table
depth has been encountered in past few decades. Rising water table in an
arid region is the cause of salinity. A lot of research has been done
in past few decades to estimate the losses due to salinity. Most of them
are on agriculture crop yield [2].
Salinity causes dampness in the wall and it is also responsible for
corrosion in steel specimens. The present studies have been conducted in
one of the major states of India where the worst effect of salinity has
been encountered in buildings. The salt accumulation on the wall up to
1m above from the surface can be easily found in almost every house in
two districts Rohtak and Jhajjar of Haryana. These studies also
emphasize to develop a new methodology for salinity monitoring over a
large urban and agricultural area by using various salinity and building
Index [3,4].
Materials and Methods
Steps involved in methodology
Water table depth analysis: In this study the
observation well data pre-monsoon and post-monsoon of the year 2013 and
2015 data of Central Ground Water board published on 2013 and 2015 has
been taken and it has been analyzed by using interpolation tool in GIS
domain and raster map has been made.
Soil and water sample analysis: Water quality data
published by Central Ground Water board or year 2013 and 2015 has been
having been taken and the data of EC, PH, RSC, and SAR has been mapped
over entire study area and raster map has been made [5].
Built-up area extraction by using NDBI: Normalized
Difference Building Index has been used to identify the residential
building in the study area.
Overlay Technique: These data sets have been exported overlay tool in GIS domain and raster map has been made.
Verification of Output Data: The output data obtained after analysis by overlay tool has been verified by using various salinity index [6] (Figure 1).

Results and Conclusion
a. The present study has been done to identify the
new saline and alkali area of Haryana state of India, Including its
effect on urban and agriculture area. The result obtained by this study
shows that out of 19 districts of only 5 districts of Haryana was
affected in the year 2013 but in the year 2015, the saline and alkaline
affected district tolls to 8. Rohtak and Jhajjar are worst affected (Figure 2).

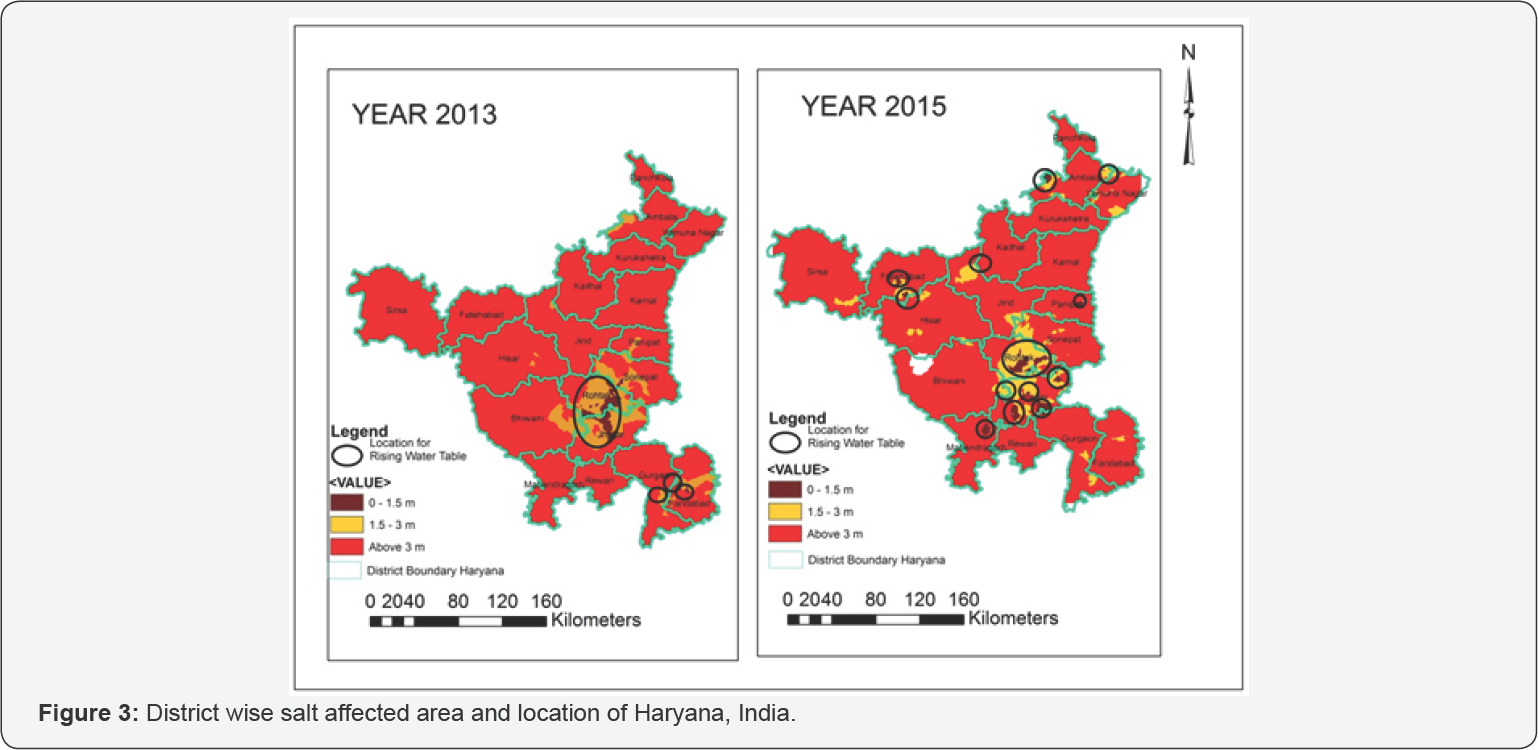
b. Remote sensing and GIS tool can be used to
identify the salt-affected land and also the estimation of sodium hazard
at urban area (Figure 3).
c. Remote Sensing indexes are very useful to detect salt affected area.
d. This technique can be used in almost all over the globe.
For More Open Access Journals Please Click on: Juniper Publishers
Fore More Articles Please Visit: Civil Engineering Research Journal


Comments
Post a Comment