Statistical Analysis of Vehicle Crashes on Mississippi Coastal Two-Lane Highways- Juniper Publishers
Juniper Publishers- Journal of Civil Engineering

Abstract
The traffic fatality per capita of Mississippi has
been at about twice the national average level in the last five years.
Although tremendous efforts have been made to develop the State Highway
Safety Plan, limited attention has been paid to good understanding of
the characteristics of the crashes in Mississippi. Due to the relatively
high percentage of heavy trucks in and out of the seaports, the traffic
crashes on two-lane county roads of the coastal area are suspected to
be more severe. A binary logistic regression model is developed to
expose the factors that contribute to the crash severity on the two-lane
county roads of the Mississippi coastal area. The study conducts
statistical analyses using the crash data of the past three years to
find possible relationships between crash severities on these two-lane
highways and the factors or combinations of factors of time of day,
environment, roadway, vehicle, driver, and driver behavior. The analysis
results indicate that those crashes that involved with vehicles, dark
lighted and dusk or dawn light conditions, drivers with no driver
license or suspended driver license, high speed, speeding, and none
restraint usage or helmet usage, tend to increase the probability to be
more severe crashes. On the other hand, it is also presented that male
drivers decrease the likelihood of fatal or injury crashes. The
predictive power of the model is tested under 10-fold cross validation.
The results show that the model has significantly higher predictive
power than a non-information guess.
Keywords: Two-lane highway; County roads; Binary logistic regression; Crash severity; Cross validation
Introduction
Significance of study
Vehicle crashes are considered among top 10 leading
causes of deaths in the United States. According to the data from the
National Highway Traffic Safety Administration (NHTSA), more than 30,000
people died from vehicle crashes every year since 1949. The numbers of
people that died from vehicle crashes are 32,479, 33,782, and 32,719
during the years 2011, 2012, and 2013, respectively, while the numbers
of people who were injured in these three years are 2,217 2,362 and
2,313 thousands, respectively [1].
Vehicle crashes, which take a major weight of traffic safety, have been
a nationwide focus in the United States. The current traffic safety
situation in Mississippi has been of great concerns. From Table 1,
it is indicated that vehicle crashes caused around 600 fatalities in
Mississippi each year in the past three years. But the fatality rate per
capita, calculated at around 20 fatalities per 100,000 population which
is almost twice as high as the US average level, is actually among the
highest in the country. The fatality rate assessed at over 1.5
fatalities per million vehicle miles travelled (VMT), is also much
higher than that of the nationwide average. The NHTSA's Traffic Safety
Facts: State Traffic Crash Data have shown that the fatality rate is
decreasing over the past decades. The fatality rate per million VMT also
decreased by 58% from 1975 to 2013 in Mississippi. However, considering
the original high level and the nationwide decreasing trends (The
fatality rate per VMT in the US decreased by 67% in the same time
period), Mississippi is still among the top states in traffic crash
rate. All these facts clearly indicate that the traffic safety situation
in Mississippi is still severe. Three Mississippi coastal counties,
Harrison, Hancock, and Jackson, which have a total population around
400,000 out of the approximately 3 million population in 82 Mississippi
counties in the state, are areas with high values in both population and
vehicle crash fatalities. Gulfport is located at the center of the
Mississippi coast and the second largest city in Mississippi after the
state capital Jackson. High freight traffic is generated due to the
transshipping of freight from cargo vessels to trucks and intermodal
operations at Port of Gulfport, which is No. 19 in the US in terms of
containership and among the top 50 US ports by port calls and vessel
type [2]. Table 2
was derived from vehicle crash records collected by the Mississippi
Department of Transportation (MDOT) in year 2011-2013, which would
explain the motivation of this study. From Table 2,
it can be shown that county road is the road class with the highest
fatality rate and injury rate. Among the 4025 crash records on
Mississippi coastal county roads, 3684 (91.53%) were on 2-lane highways,
which indicates that 2-lane county roads are hazardous spots that
entail more attention. Mining out factors that contribute to more
frequent and severe crashes would be the first step to improve the
undesirable situation on 2-lane highways of the Mississippi coastal
area.


Statistical models
In the past twenty years, numerous studies have
applied statistical models on crash analysis. Traditionally, negative
binomial models have been applied to assess highway safety based on
crash counts and crash rates [3-8]. Crash frequency models were developed for each collision type [3].
They analyzed the individual collision types by comparing the aggregate
model results. The results indicated that annual daily traffic (AADT),
lane number, and the presence of turning lanes were positively related
with all collision types, while median width and light condition were
negatively related with different collision types. However, Pande and
Abdel-Aty [9]
pointed out the limitations of the negative binomial models. Lengths of
the segments selected to aggregate the crash data were hard to be
determined. There was not an agreeable way of optimizing the selection
of the segment lengths for crash studies.
Logistic regression models have been widely used in analyses of crash severity as a response variable. Dissanayake and Lu [10]
modeled crash severity for single-vehicle fixed object crashes
involving young drivers. By using sequential binary logistic regression,
they modeled the crash severity wit five categories, which were no
injury, possible injury, non-capacitating injury, incapacitating injury
and fatal. Factors such as alcohol or drug influence, ejection in the
crash, point of impact, rural locations, curved or graded crash location
and speed of vehicle significantly increased the probability of more
severe crashes. Restraint device usage and male drivers were considered
to reduce the crash severity level. It was also found that factors such
as weather, residence location, and physical condition did not have
significant influences on crash severity using this model. Binary
logistic regressions have been used when the response variable is
binary. Lui et al. [11] presented significant findings modeling crash severity with a multivariate approach. Shanker et al. [3] developed a predictive model of crash severity with a nested logit model. Kusano & Garbler [12]
tested the predictive power of logistic regression and machine
learning, and concluded that logistic regression slightly outperformed
machine learning. The authors also mentioned that the improvement of
prediction accuracy is very meaningful to reduce the odds of death by
guiding the trauma team to take seriously injured occupants into a
trauma center to receive necessary treatments.
The objectives of this paper are to identify the
factors that are likely to lead to more severe crashes, and to build up a
predictive model which can significantly increase the prediction
accuracy of the crash severity. The organization of the paper is as
follows: after the Introduction section, the Methodology section
presents the multivariate logistic regression model and model
validation, followed by description of the data used in the analysis. In
the Data Analysis and Results section, the variable selection in the
data analysis process and regression analysis results are presented
followed by careful checks and discussions on the prediction power of
the regression model used for the study. Finally findings of this study
are summarized in Conclusions.
Methodology
Logistic Regression Model
Logistic regression is one of the popular regression
methods which describe the relationship between explanatory variables
and a discrete response variable. The explanatory variables can be
either categorical or numerical, or a mixture of both. The model is
generally used to handle categorical variables. A binary logistic
regression is good to use when the dependent variable is a bivariate. In
this study, the dependent variable can only take on two values: y = 1
for fatality or injury, and y = 0 for property damage only. The
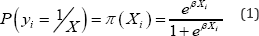
probability that a fatality or injury takes place is modeled as logistic
distribution by Equation (1):
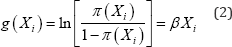
And the logit of the binary logistic regression model is presented in Equation (2):
Where p (.) stands for the probability of a severe accident (yi= 1); Xi is the vector of independent variables for theith observation; (xi)
is the conditional probability of a fatality or injury that occurs when
an accident is present; is the coefficient vector, which directly
determine the odds ratio involved in the fatality or injury; g(xi) is the link function.
The odds ratio for the jth independent variable that is equal to eβj represents the relative value by which the odds of the fatality or injury increase or decrease when the value of the jthpredictor is increased by 1.0 units.
The estimation of the coefficient vector is processed by the maximum likelihood method [13].The likelihood function is given by Equation (3):
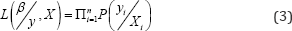
Where L (.) stands for the maximum likelihood a crash severity given the observed data. Combine Equations (2) and (3), noting that 

Taking logs, the log-likelihood function can be written as follows:

Iterations were applied to maximize the
log-likelihood function and achieve the estimation of the coefficient
vector. Due to the complex computation, the open source statistical
analysis software R program was adopted to conduct the estimation of the coefficient vector in this study.
Different plausible models were built and tested for
goodness of fit using the Wald chi-square measures, and the best fitted
model was selected as the final model. A set of null and alternative
hypotheses were assumed to construct different models and tested in the
Analysis of Variances (ANOVA). Specifically, under the null hypothesis,
the reduced model is the adequate model while under the alternative
hypothesis the full model is the adequate model. Iteratively the full
model is reduced based on each of the hypothesis tests, while the Wald
chi-square test was applied to determine whetherb or not to
statistically reject the null hypothesi based on the pre-selected
p-value for the level of significance.
Model validation
The 10-fold cross validation process was applied in
this study to test the predictive power of the selected model. If the
predictors are trained to a dataset and then the same data are used to
test the model's accuracy, and the model that over-fits the dataset is
generally considered to have the best performance. However, this
classifier may perform poorly comparing to a more flexible classifier
with new data [12]. The 10-fold cross validation method was adopted in order to eliminate the overly optimistic estimates of model performance.
The procedure of 10-fold cross validation includes:
1) divide the dataset into 10 even subsets;
2) use 9 subsets to train the model and 1 subset to test the
model; and
3) repeat the steps in 1) and 2) for10 times until all subsets
are tested as the testing dataset.
In this study, the receiver operator characteristic
(ROC) curve and confusion matrix are used to show the predictive power
of a logistic regression model. ROC curve, which consists of the true
positive rate and false positive rate, has the advantage of showing the
predictive power in a stable shape, while the confusion matrix exposes
the predictive power numerically and in a straight forward manner.
Dataset
The data for this study were provided by the
Mississippi Department of Transportation (MDOT). The original dataset
consists of vehicle crash records in Mississippi for years 2011, 2012,
and 2013. The dataset with 3684 usable observations was achieved by
screening and cleansing the data for crashes on Mississippi coastal
county roads.
Seven types of crash information were used that
included: 1) crash data, 2) temporal data, 3) environment data, 4) road
data, 5) vehicle data, 6) driver data, and driver behavior data. The
crash data includes severity and number of vehicles involved. Temporal
data is equivalent to day of week and time of day. Environment data
contains light condition, weather, and road surface condition. Road data
consists of whether or not at an intersection and pavement surface
material. Vehicle data shows vehicle type. Driver data provides
information of driver's age, gender, race, and driver licensure status.
Driver behavior data refers to estimated speed, speeding, and restraint
usage. Table 3
shows the frequency and percentage of explanatory variables. A total of
3864 records were retrieved for the county roads in the Mississippi
coast, with 1549 fatal or injury records and 2135 property damage only
records.

The missing values and unreasonable data were removed
during initial data processing. The removed data represented a small
proportion of the dataset, which means removing them would not lead to
bias in data analysis and unreliable analysis results.
Data Analysis and Results
Variable selection
The R program was applied to process and
analyze the data in the following 4 steps. First, all variables were
included in the binary logistic regression model to test the
significance of every variable. Then, variables with values larger than
>0.05 were removed iteratively to fit the reduced models. The third
step is to conduct the likelihood ratio test to determine if we need to
reject the null hypothesis that the reduced model is true. Repeat the
above steps until the reduced model was rejected and the process of
selecting variables for the regression model is then terminated. Table 4 shows the analysis results for variable selection, which are described in the following paragraphs. Table 5 presents the ANOVA results obtained from the R program.
As shown in the table, Model No. 3 is the final model in our study. It
includes variables with at least one significant category. However, age
was an exception due to the relatively small proportion (2.74%) of the
significant category for drivers aged 75 and above. Removing
insignificant variables can prevent unnecessary disturbance without
losing the predictive power of the model.


Binary logistic regression results
The odds ratios (OR) for the final predictive model are shown in Table 6,
which stand for the ratios of log probabilities of involving in a fatal
or injuring crash of a category over the reference category of a
selected independent variable. Table 6 also
lists the estimated coefficients (B) of the selected variables and the
categories of the variables to predict the log probabilities of a severe
crash. The coefficients are actually the log probabilities of a severe
crash occurring due to the independent variables, and each coefficient
stands for the change in the log probability of a severe crash
associated with one-unit change in the independent variable. The seven
variables retained in the final model include the number of vehicles
involved, lighting condition, gender, driver license, estimated speed,
speeding, and restraint usage. The effects of the seven independent
variables in the model are discussed in the following paragraphs.

Vehicles involved: All things being equal, the
OR results indicate that the log probability ofhaving a severe (fatal
or injuring) crash due to a crash involved with two vehicles is 1.3712
times as much as the log odd of crashes due to only single vehicles.
Similarly, the crashes involving with more than two vehicles have a log
probability of a fatal or injure severity 2.500 times the log odd of the
crashes involving with only single vehicles.
Light Condition: A light condition has four
categories. The OR value indicates that the log probability of having a
fatal or injury accident due to a dark light condition is 1.4099 times
that due to a daylight condition. Similarly, the log probabilities of
having a fatal or injury crash due to dark unlighted condition and dusk
or dawn condition are 1.14 and 1.69 times that due to a daylight
condition respectively. The reason why the dark lighted and dusk or dawn
conditions increase the probability of a fatal or injury crash might be
because of the misestimate of vision loss under these conditions. Being
aware of vision loss under a dark unlighted condition, the drivers
would tend to pay closer attention to the road condition and drive more
carefully, therefore could reduce the severity level of a crash.
Gender: Compared with female drivers, male
drivers are statistically less likely to be involved in a fatal or
injury crash, with an odd ratio of 0.8157.
Driver license: The results show that a driver
with an expired driver license is not statistically significant for a
severe crash. However, a driver without a driver license or with a
driver license suspended is statistically significant for a severe
crash. Compared with a validly licensed driver, the odd ratios of the
log probability of involving in a fatal or injuring crash, for a driver
without a driver license and a driver with a driver license suspended
are 1.78 and 1.63 respectively.
Speed: Compared with the reference speed
category of less than 25 mph, all other 4 categories are statistically
significant in involvement with a severe crash. Compared with the
reference speed category, the odds ratios of the log probability of
involving in a fatal or injuring crash, for driving speeds at 25-40 mph,
40-55 mph, 55-70 mph, and over 70 mph are 1.6002, 2.3938, 2.2324, and
6.7127 respectively. Obviously this analysis result shows that the
higher the driving speed, the larger the probability of involving in a
fatal or injury crash.
Speeding: The odds ratio of 1.3 in involvement
of a fatal or injury crash of a speeding behavior over the non-speeding
driving with respect to the speed limit well indicates that speeding in
driving is statistically significant in causing a severe crash.
Restraint usage: The usage of shoulder lap
belt is set to be the reference category. The odds ratio of helmet usage
at 26.85 actually indicates that a motorcycle driver wearing a helmet
is 26.85 times more likely to be in a fatal or injury crash, compared
with the log probability of a driver utilizing shoulder lap belt
involving a severe crash. The odds ratio of a driver with no restraint
usage at 5.03 well indicates the great importance of restraint usage in
avoiding fatality and injury in driving.
Prediction power
As shown in Table 7,
the confusion matrix under the 10-fold cross validation method has
measured the predictive power of the final model developed in the binary
logistic regression. The accuracy of the prediction at 0.6509 is
significantly higher than the non-information guess at a value of
0.5795, which indicates that the logistic regression has a significantly
higher predictive power than a non-information guess. The receiver
operator characteristic (ROC) curve was also plotted to present the
predictive power. The advantage of ROC curve is its stability in shape.
The area under curve (AUC) is the index to evaluate ROC curve. A larger
AUC means better predictive power. Figure 1 presents the AUC of the ROC curve of this logistic regression model which was assessed at 0.6805.


Conclusion
This study uses a binary logistic regression model to
identify the factors that possibly contribute to the crash severities
on two-lane county roads in the Mississippi coastal area. Vehicle crash
severity is considered as dependent variable. Seven types of data, which
include crash data, temporal data, environment data, roadway data,
vehicle data, driver data, and driver behavior data are the explanatory
variables used in predicting crash severity. The analysis is conducted
using the R program. The variables with at least one category
statistical significance were retained in the final model.
As discussed in the paper, the analysis results
indicate that compared to single vehicle crashes, the crashes that
involved with two or more than two vehicles have a higher probability to
be fatal or injury crashes. It is shown that dark lighting and dusk or
dawn, as compared to daylight, increase the probability of fatal or
injury crashes. Males are found to be less likely to be involved in
fatal or injury crashes. Drivers without driver license are more likely
to be in more severe crashes. Drivers with driver license suspended,
especially suspended due to DUI, have a larger chance to be in fatal or
injury crashes. The probability to be in fatal or injury crashes is
greater with a higher vehicle speed. Speeding also leads to more severe
crashes. The restraint usage greatly impacts crash severity. No
restraint usage apparently increases the probability of fatal or injury
crashes. Compared with car driving, motorcycle driving even with helmets
on are much more prone to severe crashes. The confusion matrix under
the 10-fold cross validation method shows that the binary logistic
regression model has a significantly high predictive power than a
non-information guess.
Acknowledgement
The project received research funding support from
the Institute for Multimodal Transportation (IMTrans) at Jackson State
University. The IMTrans is member of the Maritime Transportation
Research and Education Center (MarTREC) with the University of Arkansas
(lead), Louisiana State University, and the University of New Orleans.
MarTREC is one of the Tier I University Transportation Centers funded by
the US DOT. Traffic engineers Christopher Kimbrell, Jim Willis, James
Sullivan, and Wes Dean at the Mississippi Department of Transportation
are thanked for providing data support to the study.
For More Open Access Journals Please Click on: Juniper Publishers
Fore More Articles Please Visit: Civil Engineering Research Journal
Fore More Articles Please Visit: Civil Engineering Research Journal


Comments
Post a Comment