Visual Interpretation of DEM Fill Mechanisms for a Rope Shovel Dipper in Dry Broken Rock- Juniper Publishers
Juniper Publishers- Journal of Civil Engineering
Abstract
A discrete element model (DEM) particle flow code
(PFC) based 2D numerical simulation was used to model the behaviour of
crushed cohesion-less rock fragments passing into a rope shovel dipper
(bucket); mimicking previous field verified physical 1/32nd
scale tests. While the previous physical tests showed the development of
a previously unknown void space within the dipper that perpetuated low
dipper fill factors; the model reported in this paper was developed to
show the impact of particle size characteristics on the ability of a
given shovel dipper geometry to fill, within a set arc dig trajectory.
In comparison to the previous scale physical tests, a
good correlation to the DEM indicated that the numerical method was
able to mimic the dipper fill process; specifically particle flow mode
sand development of flow layers and particle obstructions, akin to
sanding in a low velocity hydro-transport pipeline.
Keywords: Rope shovel; Particle flow; Simulation; Discrete element method; PFC; Dipper
Introduction
A particle flow code (PFC) based discrete element
model (DEM) presents a viable tool to numerically model ground engaging
tool interactions; which may be used to mimic and predict complex
surface versus media concerns that are manifest as low productivity KPIs
[1].
Such DEM methods have been widely used to predict the flow behaviour of
rock materials for several decades, providing tangible solutions for
industrial and mining problems [2].
Coetzee et al. [1-5]
modeled the flow of broken rock particles into a dragline dipper using
DEM, proposing a means of estimating the input parameters required for
the modeling of cohesion-less material, where the size and density of
particles were assessed through direct measurement. Coetzee et al. [1-5]
showed that particles for a range of frictional and size
characteristics could be represented by clumps of varying size PFC
spherical particles interacting with one another. This early work was
verified through mimicking of a confined compression test [1]. However, Coetzee et al. [1,3-5]
concluded that although a general modeling trend was indicated, the DEM
was unable to predict the dragline bucket-ground interaction with the
anticipated accuracy[1,3-5].
Cleary [6,7]
in preceding the work of Coetzee et al. [1,3- 5], modelled the fill
process for a dragline dipper using DEM to compare the loading for
different dragline bucket designs, and to evaluate the loading impact on
the dragline bucket hoist and drag rope system. Cleary specifically of
interest for this paper, studied the effect of particle shape on fill
times and bucket fill volumes achieved, noting the two rock shape
parameters of aspect ratio and sharpness appeared to greatly influence
the behaviour of a particle’s ability to fill a dragline bucket [2,8], modelled via PFC encoded spheres and spherical based super-quadric hybrid shapes in DEM-3D [8,9].
Cleary’s results indicated that non-spherical particles showed more
resistance to flow, more representative of the friction resistance of
rock particles to flow resulting in lower fill factor payloads, but with
an increased fill time [9]. In parallel work, Owen et al. [10]
simulated a dragline bucket fill, where particles were modeled via
DEM-3D and the bucket load response was modeled via finite element
modelling [10], such that drag forces and trajectory distances were shown comparable with a scale physical test.
Following the work of Coetzee et al. [1,3-5], Cleary [2, 6- 9] and Owen [10],
this paper will show a parallel DEM application to investigating the
flow of broken rock particles into a rope shovel dipper, where there is
strong correlation to 1/32nd scale physical tests using a transparent
dipper and test bin, permitting the visual inspection of material
behaviour as previously reported by Rasimarzabadi & Joseph [11].
DEM as applied to a shovel dipper passing through a
digging medium, then employs two principal elements to define rock
particles and the shovel dipper rigid body; as spheres and walls
respectively [12,13].
In 2D simulations, a sphere is a stiff circle with unit thickness;
while in 3D simulations, a true spherical shape is defined [14].
To model non-circular (non-spherical) particles that may then be
attributed higher surface frictional properties, as might be expected
for highly angular broken rock fragments in a blasted rock file under
shovel dipper excavation; clumps of multi-sized spheres were used, where
a clump was a combination of two or more spheres that remained rigid
under all modeled conditions [14].
To provide a comparator and by extension a scaled
validation of the DEM numerical results, a set of scaled physical tests
were performed, after Rasimarzabadi & Joseph [11], using a transparent scaled rope shovel dipper and test bin arrangement (Figure 1). The scale testing was based on well accepted physical testing scaling laws as reported by Ghosh & Chakraborty [15].
The 1/32nd volumetric cube root scaled dipper model referenced a 44m3
ultra-class category field scale dipper found on Komatsu P&H4100 and
Caterpillar 7495 model electric rope shovels in common large scale
surface mine hard rock operations. The scaled dig medium was constructed
from crushed dolomitic limestone rock mimicking the field particle size
distribution relative to the shovel dipper geometry. As such, the field
mean rock particle size of 0.380.32m relative to a 44m3 capacity dipper
with a 3.58m wide lip set the 1/32nd scale 1,340 cm3 capacity dipper
with a 11 cm wide lip and 1.21 cm mean size broken rock. The dolomitic
limestone was chosen as it fractured under crushing producing similar
angularity and surface roughness commensurate with a field hard rock
blast excavation face.
The scale dipper hoist system was effected in a
similar arc trajectory to that experienced by the field rope shovel
system, relative to a 1/32nd scaled dig trajectory for the same dig
cycle time experienced in the field, such that a dig velocity range from
0.450.5 to 0.951m/s was then set at 1.41.6 to 3.03.1cm/s. The
transparent wear bin dig face height was also scaled from 12m in field
to 37.5cm in height at a similar angle of repose of 38, (Figure 1).
With all geometries scale matched from field to test scenario, the flow
mechanisms generated through the dipper to dig face interactions were
then commensurate with the field conditions, permitting high speed
camera visual observation of the particle flow characteristics into and
around the scale dipper as it passed through the dig face material.
Specific operation details for the testset-upmay be found in
Rasimarzabadi [16] and Rasimarzabadi & Joseph [11].

Defining Model Particle Material Properties
Although DEM simulation relies on micro- rather than
macro-properties of materials, where micro-properties of materials with
simple packing arrangements such as spherical contacts may be predicted
from material macro-properties; it is more difficult to determine broken
rock particle material properties, where arbitrary particle
orientations are present. In this instance, to assign appropriate
micro-property values for broken rick rock particles, calibration
methods are required; where density, particle shape, particle size
distribution, shear stiffness and friction define those micro-properties
[1,13,17].
For example, apparent (broken rock) density may be determined and used
as an appropriate particle density for PFC modeling purposes [18].
In DEM models, particles are represented by discs
(2D) or spheres (3D). Such particles do not represent broken rocks well.
However, DEM is capable of modeling particles with noncircular,
non-spherical shapes by creating clumps of discs or spheres of different
size and configuration [14].
To determine the representative shape of particles commensurate with
that used kin the scale physical tests, a random sample of 250 particles
was taken from the dig face material. These particles were classified
into three groups based on their overall shape. For simplicity, where
complexity of modeled particle is directly proportional to computing
power needed to run a given model, the classification was restricted to
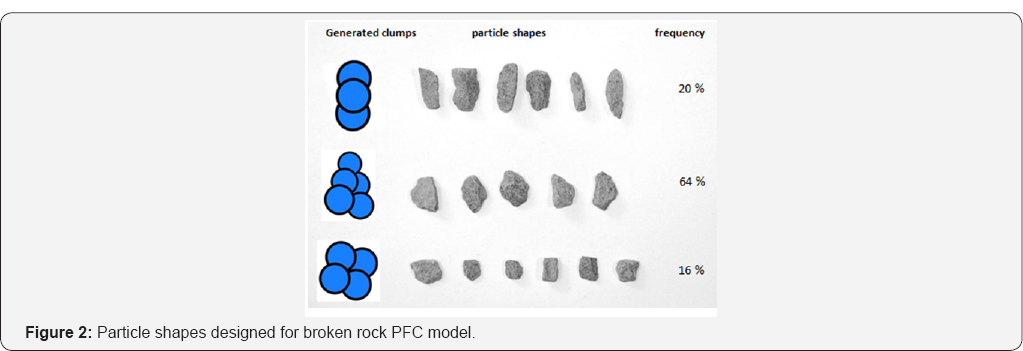
three clumped particles designed for PFC use. Figure 2 shows the three shapes designed to mimic the broken rock particles relative to frequency of occurrence in the dig face.
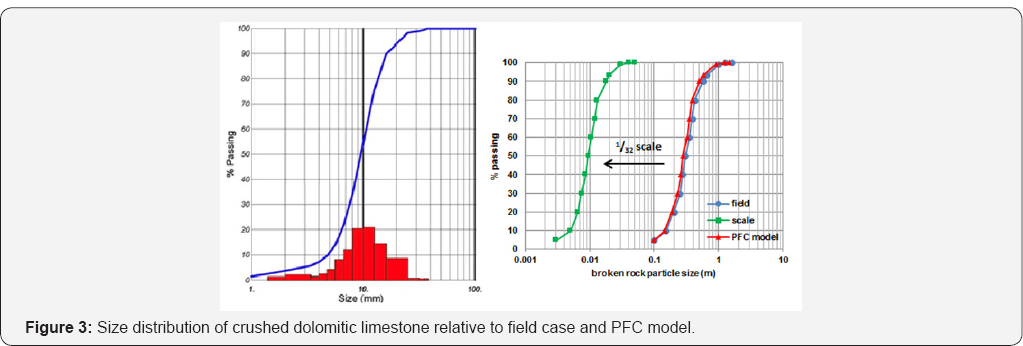
To determine the 1/32nd test size distribution for
the crushed dolomitic limestone, the digital image processing system,
WipFrag, was used, generating the distribution in Figure 3;
compared with the field dig face blast size distribution being mimicked
and the PFC model size distribution. A user defined FISH function was
written to model the scaled up results from Wipfrag, producing a
comparable match to the scale and actual rock particle distribution.
In order to estimate particle to particle model
stiffness commensurate with the actual material frictional and geometric
contacts, a simple packing simulation was conducted, where particles
fall into a container under gravity and settle to equilibrium. As such,
it was assumed that normal and shear stiffness were equal. The stiffness
model comprised eight containers filled with particles of similar
characteristics but different stiffness. The model was influenced by the
shape and size distribution of the rock particle fragments used in the
physical test.

In Figure 4,
container 1 presented the lowest particle stiffness, with large void
spaces. Increasing the particle stiffness in containers 2 through 8,
from left to right, it was observed that the height of particles in the
containers proportionally increased, resulting from decreased particle
overlap. It was also observed that a proportional change in stiffness
(columns 5 through 8), had a minimal impact on the change of particle
height in the container. Majidi [17]
argued that where stiffness change had a minimal impact, the particles
were then compacted with minimal overlap. To reduce the model
computational time step, a minimal value of stiffness was selected at
kn= ks = 1exp06.
The broken rock particle to particle friction
coefficient is a critical parameter in establishing the angle of repose
of the dig face in numerical modeling using PFC. Since the angle of
repose is a reasonable indicator of an effective friction co-efficient
for cohesion less broken rock fragments, the angle of repose was used to
indicate the friction co-efficient [19]. The dolomitic limestone particles used in the physical test were poured onto a horizontal surface, (Figure 5).
The pile conic angle relative to the horizontal was taken as the angle
of repose of broken material. For a number of piles, a mean angle of
repose was determined. The pile angle of repose test was simulated in
PFC2D for different friction coefficients, revealing outcomes comparable
to the physically measured angle of repose and focusing on an
appropriate friction coefficient value for simulating the dolomitic
limestone broken rock.

Frictional sliding between the components of a system
reduces the energy of the system; but frictional sliding alone is
insufficient to establish a state of equilibrium in a model [14].
Local damping and viscous damping are two options to reduce kinetic
energy in PFC; where local damping generates a damping force on each
particle that has a value comparable to an unbalanced force, while
viscous damping provides a damping force comparable to the relative
velocity difference between two particles in contact [14].When a system needs to rapidly reach an equilibrium state, local damping works best [13].
For systems with dynamic behaviour, or systems where particles are free
to move in the domain area, viscous damping is more suitable [14].
However, damping is a property that does not have a specific calibration method [13].
Here a set of test runs were conducted to evaluate different damping
coefficients. Analysis of the results implied that both local and
viscous damping was potentially needed. Viscous damping was a good
option for systems involving free flowing rock particles, as is the case
here; once establishment of the dig face file pile was achieved,
leveraging local damping to establish a reasonably steep dig slope angle
of repose. The local damping coefficient absorbed undesirable energy
generated when establishing the dig face pile as material dropped onto a
horizontal surface which under un damped conditions would generate a
low rock material angle of repose.
Processing Time
In DEM, the total processing time depends on computer
processor power. Long simulation periods revealed that it was necessary
to employ appropriate strategies to shorten total processing time. In
PFC, two parameters that may be manipulated to control simulation time
are the time step and cycle time [13].
The process duration, a function of the simulation setup and complexity of parameters, may be shortened by [13]
reducing the quantity of objects in the system, including modeling
spheres, clumps, and walls and reducing the time taken to generate the
rock particles and dig face from spheres and clumps. Here, the number of
calculations performed per cycle was reduced by decreasing the number
of rock clump particles and number of shovel dipper and dig bin walls in
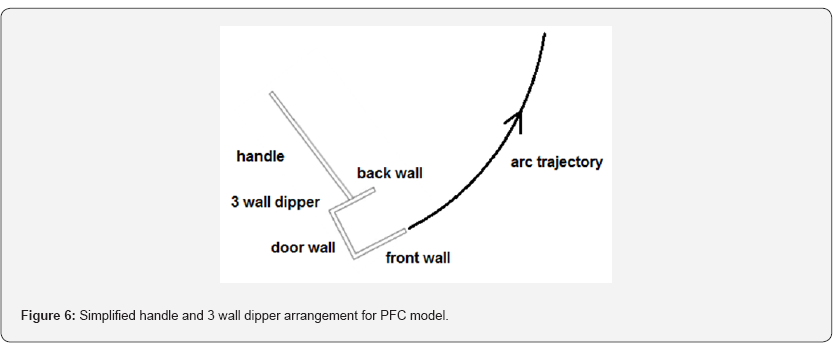
the system. As such, the dipper was modeled as the simplest geometry
possible, Figure 6 and generation of highly complex particle clump shapes were avoided.
Generating a broken rockpile with a broad size
distribution of particle sizes and shapes adversely extended the model
computational processing time, given the large proportion of generated
clumps required in the system, thus limiting the number of runs
possible. As such, rather than generate the entire DEM broken rockpile
from clumps, the rock particle to dipper contact zone was focused as a
capping layer of set thickness over a set linear slope at the angle of
repose.
To further reduce the processing time, the time step
was increased. In a linear contact model, the time step is dependent on
particle stiffness, density, and size [13].
A lower stiffness results in a smaller time step; however, small
magnitude stiffness causes unrealistic overlaps between spheres and
clumps as evident from (Figure 4), [17].
It should be borne in mind that conversely a higher stiffness may also
result in unrealistic behaviour, due to high forces generated between
two particles in contact [17].
DEM Simulation Material Flow Into A Rope Shovel Dipper
Once the particles for the surface layer of the
rockpile were created, they were permitted to reach an equilibrium
state. The dipper was then created into the model using rigid walls,
initiated in the model at the toe of the rockpile. The dipper was then
moved through the particle layer by assigning a rotational speed to the
dipper walls. The motion behaviour of the particles and the loading flow
mechanism were recorded, and compared to the experimental test
observations reported by Rasimarzabadi & Joseph [11].
The results indicated good correlation to the dipper - material flow filling process seen in the physical tests [11].
It was specifically observed, as a qualitative key indicator of
modeling success, that as the dipper engaged the rockpile, a thin layer
of material flowed into the dipper (flow zone), with particles rotating
and sliding relative to each other. An increase in broken rock pile
penetration by the dipper, prior to moving along the trajectory path,
resulted in greater material being displaced and flowing into the
dipper, proportional to an increased thickness in flow zone.
As more rock particles entered the dipper, those
adjacent to the inner dipper walls, interlocked to particles that they
came into contact with, generating a bulk larger volume zone moving much
slower into the dipper, while the previously identified flow zone was
now forced to flow over the slower moving bulk zone. The closet analogy
to this would be 'sanding' in a slurry pipeline, where solids of larger
mass or density drop out of the main flow regime and create a
restricting pile in the base of a pipeline, impeding the ongoing flow of
a slurry. The simulation here clearly showed the mode of two motions as
the flow and bulk zones.
Observed both in the physical tests [11]
and in the model here, the flowing material into the dipper generated a
flow restricting pile, inside the leading edge (lip) of the dipper
front wall, which progressively increased in size through the dig cycle.
Given the progressively increasing restriction as the dig cycle
progressed along the dipper trajectory, a void space was generated at
the contact between the back and door walls of the dipper. As the
restriction increased in size, less material was able to progress in the
flow zone to fill the dipper, and hence the void space became
inaccessible to fill. In the physical test [11]
it was observed that the void space remained set to the point at which
the thickness of the flowing material over the bulk zone approached the
back wall of the dipper. In rotating the dipper as it proceeded to the
end of its trajectory and broke out of the dig face, the material
contained in the front of the dipper sloughed into the void space,
effectively transferring the void from backdoor corner to back-front
opening zone.
Although the numerical model was successful in
simulating the general flow pattern, it had some restrictions in
reproducing the physical test results. Figure 7 compares the results of the DEM model versus the physical test.
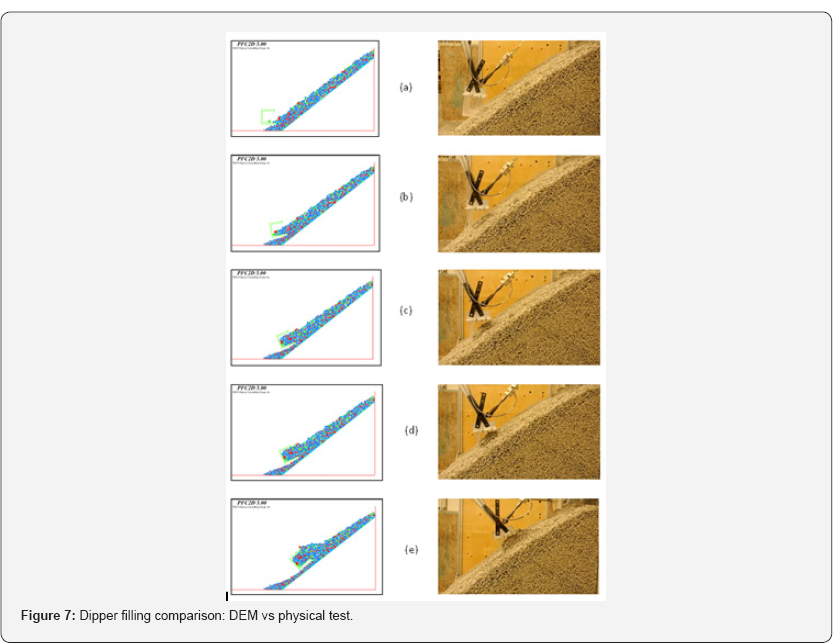
Figure 7a
shows the dig cycle initiation, where the dipper first engages the
broken rock dig face pile. The DEM seems to have reasonably simulated
this segment. Figure 7b
then illustrates the point at which the flow zone material contacts the
rear-door of the dipper. Although the height of material at the
dipper's ingress appears the same in the physical test and numerical
model, the particle slope forming inside the dipper appears more shallow
in the simulation.
In progressing through the dig cycle, a wedge of
particles inside the ingress at the front wall of the dipper is formed,
the thickness of which progressively increases, but again with an
apparent pile slope noticeably reclined in the numerical model. This
results in a much smaller void space developing at the rear of the
simulated dipper, Figure 7-c and Figure 7d.
As the thickness of the material obstruction at the dipper ingress
reaches the dipper back wall, the size of the void space in the DEM
model becomes insignificant Figure 7e.
The DEM model results did indicate that although the
simulated material showed the same flow pattern as evidenced by the
physical test results, it did not adequately mimic the void space
generation that consistently impacts fill factor for such shovel dippers
in industry. It is evident that the simulated particles moved past one
another with a much lower fictional resistance than anticipated, and as
such did not behave as angular, rough particles. This resulted in a
lower angle of repose pile of material developing inside the front wall
of the dipper, and a smoother flow of particles than the physical test
case, more easily able to fill the void space at the rear of the dipper
On reflection, the model was hampered by poor assumptions of particle behaviour
a. Roughness of particles: In an attempt to
generate rough particles via more complex clump geometries, the
computing power limited complexity. Simple clumps were chosen, but were
not complex enough to generate the roughness and friction response
expected. As surface roughness increases, the value of the
inter-particle friction coefficient increased which lead to reducing
rolling ability and increased interlocking; where as smooth particles
were able to move past one another via sliding and rotation with only
limited resistance.
b. Friction coefficient: The inter-particle
friction coefficient defines how difficult it is for the particles to
move over one another. Too low a particle friction coefficient results
in particles moving easily over one another and permits the dipper
structure to penetrate deeper into the dig face material. The friction
coefficient in the PFC model was determined from the angle of repose
calibration. However, higher friction coefficients were examined showing
that an increase in friction coefficient had no significant influence
on results. It is believed that the impact of the particle shape,
representative of the roughness of the particles, was more significant
than the value of the friction coefficient used in the model.
Contact and damping models: PFC is primarily employed
for static systems. Employing these methods in dynamic models may
generate unforeseen issues [13]. Different damping values were examined and those that worked best with the model were selected.
Compaction and rock particle interlock: The PFC
method used to generate the dig face broken rock resulted in a low
degree of particle interlock and effective material compaction; which
decreased the effective frictional resistance to a dig implement. The
major obstacle in this study was to create a representative broken rock
dig face.
Understanding the Void Space in the Dipper
The major difference between the numerical model and
the physical test observations was the degree of generation of void
space at the back wall - door wall contact of the dipper. Due to the
importance of understanding the generation of this void space, further
simulations were performed to investigate the capability of DEM to model
such a phenomenon. Shi [20]
previously stated that in rope shovel dipper operation, the void space
is generated at the end of the dig cycle, located at the leading edge of
the dipper back wall. Shi [20] was however not aware of the filling mechanism that gave rise to the initiation of the void space.
To improve the PFC DEM model with a greater effective
friction restricting the flow of particles into the dipper, previous
research indicated that a mixture of fine and coarse particles reduced
particle resistance to move relative to one another due to the
lubrication influence of finer particles [21-23].
The revised simulation model replaced the previous uniform size
distribution with a broader range of larger rock fragment material
sizes.
While the revised simulations were performed with
different particle sizes; other properties were kept constant. Particle
sizes of 0.152m, 0.32m, and 0.8m, were trailed effectively representing
small, medium, and large particle sizes, the latter medium and large
sizes reflected in Figure 8.
For the smallest particle size modeled at 0.152m, the same smooth flow
of material as originally modeled with the broad size distribution
evident in Figure 7
was discerned. In the small particle size case, little digging
resistance due to a low friction coefficient was evident. Under such
conditions, there exists a low likelihood of void space generation in a
dipper, corresponding to a high achievable payload.
Figure 8 shows
that by increasing particle size, the void space generated during the
dig cycle also increases. Common with the results of the physical scale
tests, the void space develops as the ingress of the dipper is blocked
by incoming material. In Figure 8,
rotating the dipper orientation at the end of the dig cycle caused the
particles to fill the void space and generate a new void space at the
front of the back wall, transitioning the void space to its final
location, as was commented on by Shi [20].
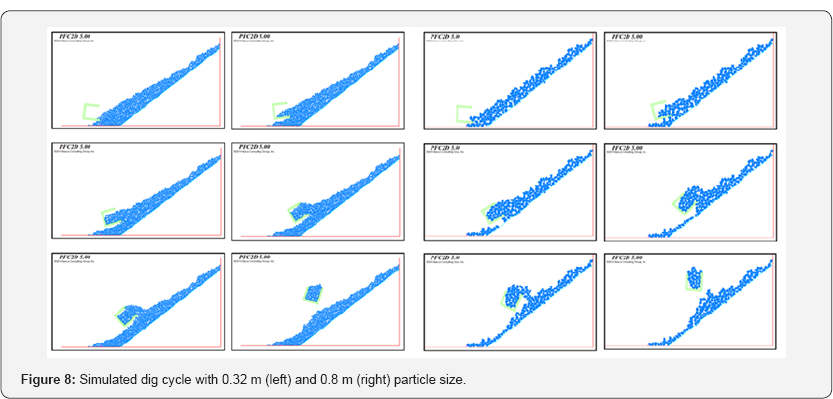
Figure 8
which also shows large 0.8m particle sizes, illustrates that even in
rotating the dipper orientation, the material is unable to flow into the
void space of the dipper due to more pronounced particle to particle
interlocking, so the void space can be seen maintained in the same
position to the end of the dig cycle. This is what would be logically
expected for very large particle sizes.
Modifying the properties of the simulated
particles in the DEM model produced results that were more
representative ofthe physical test experience. The void space phenomenon
realized in the model represented in Figure 8 is significant; as it represents the physical test evidence of Rasimarzabadi and Joseph [16],
as a previously unknown dipper fill phenomenon. This knowledge now
provides the impetus for dipper manufacturers to review dipper designs
with the goal of negating a void space generation during the fill cycle.
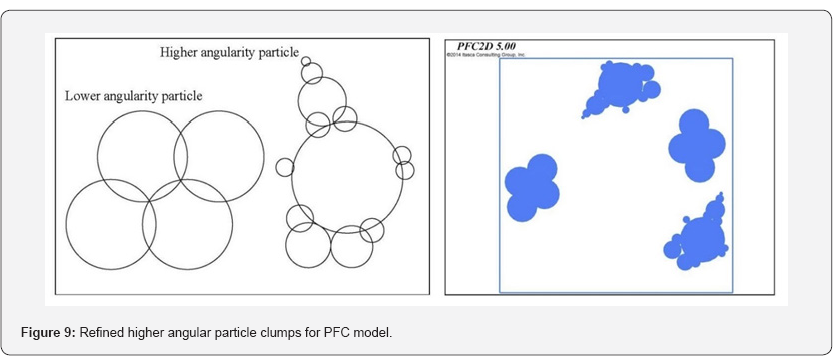
To generate particles with higher frictional
resistance capable of giving rise to a steeper dig face pile, particle
shapes were constructed to represent moderate and high angularity
materials, Figure 9.
This was in turn varied via particle sizes of 0.32, 0.8, and 1.2m, then
termed small, medium, and large particles, relative to the ingress
across the lip system of the dipper, where the largest particle size
passing was rated as being less than 1/3 of the dipper lip width, such
that for a 44m3 'box' shape dipper the largest particle size is
estimated at 1/33^44 equivalent to 1.18m.
Dig piles were created using the clumps shown in Figure 9 representing
moderate angularity for the three different particle sizes with the
overall size distribution commensurate with the physical scale test
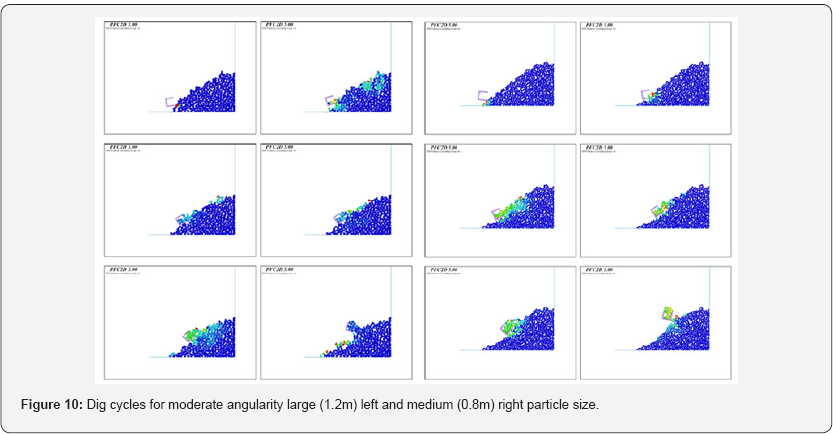
material and field conditions. Figure 10
illustrates sample dig cycles for the large (1.2m) and medium (0.8m)
particle sizes, where the blue to red colouring indicated zero (blue) to
high (red) levels of induced particle motion due to the dipper - ground
interaction.
As previously reported through the physical test results [16],
the general particle fill flow was similar for all examined particle
sizes; but the size of particles did impact dig efficiency; a function
of the steepness of the dig face as the angle of repose, increasing with
increasing particle size.
In Figure 10
(left) where the large particle size was roughly equal to 1/3 of the
dipper lip width, at 1.2m, it is evident that during the first half of
the dig cycle large particles blocked the dipper ingress restricting
further particle flow into the dipper. However with changing the
orientation of the dipper, gravity assisted obstructing particles moving
further back into the dipper, thus permitting more material ingress.
The medium 0.8m particles in Figure 10 (right) had little difficulty in flow into the dipper, reflective of an easier set of dig conditions.
As previously seen in the physical tests [16],
a void space was evident in all simulations, but the void space size
reduced with decreasing particle size. Commensurate with a smaller void
space, as would be expected, the overall final dipper fill suggested a
higher payload with smaller particle size and less likelihood of dipper
ingress restriction. The results then indicated that particle size has a
significant influence on loading action, highlighting the importance of
blast fragmentation for excavating application.
The issue with blast fragmentation prediction is that, as illustrated in Figure 11, there is frequently an over-estimate of smaller particle size fractions compared to actual distributions inset from Figure 3. The Kuznetsov-Rosin-Rammler fragmentation model shown in Figure 11 was
generated for a dolomitic limestone modulus of 15 GPa commensurate with
field conditions, where a 6.25 m burden by 9 m spacing blast pattern of
235 mm diameter blast holes were loaded at 8.5 m charge length with
emulsified 1.17 relative strength ANFO explosive for a 13 m bench
production blast at a powder factor of 0.62 kg/m3. Although there is
evidently a different size distribution particularly with reference to
smaller particle sizes, the maximum size of 1.18 m for the shovel dipper
was approached, and the d50 50% passing characteristic size fraction
was the same at 0.3m. As such a combination of existing blast
fragmentation analyses combined with the DEM model observations in this
paper provides a useful tool in predicting shovel dipper interactions
with fragmented rock.

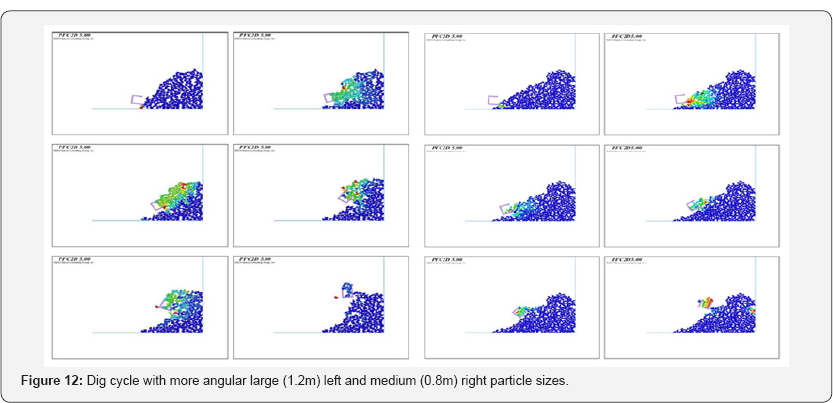
To further investigate the influence of particle
shape, specifically particle angularity on flow pattern, a model was
generated using high angular clumps, Figure 12 then illustrates the results for the medium and large particle sizes.
Effectively the higher the angularity of the
particles, the steeper the dig face pile, with the more angular
particles showing a greater tendency to block the dipper ingress and
promote a dipper internal void space. Figure 12
clearly shows an ingress restriction from the onset of the dig cycle.
It is evident that as angularity increases, particles cannot easily pass
one another and become interlocked, effectively requiring that
particles overcome a higher frictional resistance due to rolling
limitation.
Conclusion
A series of DEM simulations were performed to
evaluate the dynamics of filling a rope shovel dipper and investigate
the capability of DEM against physical test evidence commensurate with
field conditions.
The modeling results showed the DEM simulation was
able to mimic the broken rock particle flow noted from the physical
scale tests.
The DEM simulation was shown to successfully model
the flow of broken rock particles into a rope shovel dipper, predicting
many of the trends seen during scale physical testing. The flow
mechanism stages including particle flow layers identified in the
physical tests were identifiable in the numerical simulation. The
process of void space generation inside the dipper was clearly evident
in the numerical simulation once the particle size, surface angularity
and roughness; proportional to frictional resistance and angle of
repose; were delineated through particle shape refinement in the DEM. It
was specifically observed that the more fluid a digging condition
observed in the simulation output, the lower opportunity to generate
void space was evident, proportional to the quality of rock blast
fragmentation.
For More Open Access Journals Please Click on: Juniper Publishers
Fore More Articles Please Visit: Civil Engineering Research Journal
Fore More Articles Please Visit: Civil Engineering Research Journal


Comments
Post a Comment