Drift Response of Irregular Lightly Reinforced Concrete Frames in Low Seismic Zones- Juniper Publishers
Juniper Publishers- Journal of Civil Engineering

Abstract
The drift response of lightly reinforced concrete
frames in low seismic zones is studied in this paper. The frames under
study comprise vertical and/or plan irregularities and are designed for
only gravity loads as in a low seismic zone. Nonlinear time history
analysis using scaled ground motions is the selected approach for this
study. Drift is a major consideration in any seismic hazard analysis.
Thus, damage levels are addressed according to [1]
definitions by comparison of drift responses. The maximum drifts are
classified according to the number of story and type of irregularity. A
comparison between results of models demonstrates that the drift levels
under low seismic intensity are in range of low to moderate; however,
the severity of drift is more for most of two story models.
Keywords: Irregularity; Lightly reinforced concrete; Low seismic; Asymmetric plan; Soft story; Time history analysis; Drift
Introduction
There in forced concrete (RC) structures that do not
comply with seismic provisions usually are referred to as Lightly
Reinforced Concrete (LRC), and mostly were designed with earlier
editions of building design codes [2].
LRC structures comprise the majority of RC buildings in majority of low
to high intense seismic zones [Ibid.]. In low to medium seismicity
zones, such as in the Northeast of the United States (US), RC structures
were basically designed for gravity loads only [3]
where reinforcement and details of RC structures do not comply with
modern seismic standards. However, they may still hold some degree of
inherent lateral strength capacity primarily due to applied safety
factors, higher material strength, and so.
Besides, inventories of multi-story RC buildings in
the US where the architectural design have largely applied
irregularities are significant. Combination of "soft first story" and
"asymmetric plan" when they combine can be found both in seismic and
non- seismic zones. Almost all codes and building standards put on
restrictions for irregularities, especially in high seismic zones. The
code provisions for torsion and elevation irregularities are derived
mostly from elastic studies or from simplified inelastic studies.
Structural irregularity consists of irregular distribution of stiffness,
strength, and mass within the structure height and/or plan. However,
research is rare in taking both vertical and plane irregularities in one
structure into account and studying their side effects as a whole
response. Almost all research focus on vertical or planar irregularity
individually. A review of De Stefano and Pintucchi [4]
study regarding major irregular research may explain the aforementioned
statement of insufficient amount of study into vertical and plane
irregularities. Lack of appropriate code definitions for combination of
both plan and vertical irregularities is another issue. Furthermore,
structural system irregularity does not depend exclusively on structural
properties, yet the ground motion characteristics and the distortion in
structural properties shall be stipulated [5]. Response of irregular LRC structures in low seismic zones has been presented before by Rezavandi and Fu [6]
which covers the damage stage and number of formed hinges. The former
study addressed damage levels associated with hinge formation, while the
current study is focused on drift results.
The Eastern and North eastern areas of the US are usually accepted as low seismic zones. ASCE 7-10 [7]
defines the Seismic Design Categories (SDCs) from A to F. In the
Eastern and North eastern areas of the US, SDCs B and C are the most
common hazard categories with some higher and exceptional categories
toward the Central US [8].
In this part of the continent, there are infrequent and low to moderate
scale seismic activities. For example, the August 2011 earthquake in
Virginia was a moderate to low magnitude seismic event. However, total
damage
estimated to be about $300 million in total and spread over a large area
[9].
Drift is a key element in seismic design of new buildings [e.g.7] or retrofit ofthe existing structures [10].
As mentioned before, lack of enough study in the low seismic zone area
may lead to design or retrofit of irregular structures without a clear
view of their possible response. This study can be useful as drift
damage is a main consideration for any seismic hazard analysis. The
results can be useful to the insurance companies, governmental
authorities, consultants, owners, and financial institutes.
Brief review of the selected model
This drift study emphases on the drift response of
selected LRC frames with vertical and/or plane irregularities in low
seismic zones with focusing on the Eastern and Northeastern parts of the
US. The effect of low seismic instigation on LRC structures with
vertical and/or plane irregularities is discussed here. The selected
models are two (2), four (4), and eight (8) story frames, under three
main families: BASE models without any irregularity, SYMETRIC models
with the first tall story irregularity, and ASYMMETRIC models with the
first story plan irregularity that may or may not have the first story
elevation irregularity. The designated abbreviations for each group are
letter B for Base, S for Symmetric and A for Asymmetric condition
accordingly. The digit before the designated letter illustrates the
number of levels, while the number after the designated letter denotes
the first story height per foot measure. For example, model 4S18 means 4
story symmetric plan model which its first level has 18 feet (5.49m)
height. To study plane irregularity similar to the typical construction
in the US, the central columns are eliminated. A brief review of the
static analysis assumptions, material and sections, and selected models
is explained by Rezavandi and Fu [6].
Nonlinear Time History Analysis (THA) is executed
using a step-by-step integration to compute the results. Nonlinear
assumptions and methodology are according to FEMA 356 [1] procedure. Nonlinear computer software SAP 2000 [11] is used to perform analytical procedure and to obtain the drift results.
The drift response of LRC structures is done by
considering relative story displacement, drift of the models. Story
drift is one of the most practical and relevant measurements in the
seismic design and studies of irregular structures. ASCE 41-06 [10]
defines drift as "Horizontal deflection at the top of the story
relative to the bottom of the story." In this study, acceptable
structural performance levels and damages regarding drift is mentioned.
These criteria are according to FEMA 356 [1] and ASCE 41-06 [10] for concrete frame structures.
Nonlinear Assumptions for Selected Models
To study dynamic response of the models, masses are
allocated at all floor levels. The two nonlinearities of each THA case
are (1) the first nonlinear step is P-A and then, (2) the final P-A
state comprises the initial nonlinear condition for the gravity load
according to FEMA 356 [1]
requirements. Super position method cannot be used for nonlinear
procedure, and former steps cannot be directly combined in THA response.
Thus, the final step of nonlinear gravity combination acts as the
initial state of any nonlinear THA analysis respectively. By this way,
effect of gravity load would be effectively addressed.
Time history records selection


To select ground motions, PEER seismic database, Beta version, is used [12].
The concept of spectrum matching is the basis of PEER scaling approach,
and assumptions and selected data are described in another paper [6]. One of the parameters in the target spectrum method is the period range or period interval. NEHRP [13]
recommends to imply interval between 0.2T (minimum) and 3T (maximum)
for moment frame buildings where T denotes the lesser (or greater) of
the first mode translational periods along the two main horizontal axes
of the structure. In this study, the period range is selected according
to the median of the selected models, i.e. the four (4) story basic
model (4B12), which are [0.348s, 5.37s]. By using PEER database [14],
three pairs of records are chosen: Whittier Narrows (WNA), Loma Prieta
(LPR), and Northridge (NOR). The selected records are from specific
stations that provide required and requested scaling criteria. Each
selected record is divided into two parts, Fault Normal (FN) and Fault
Parallel (FP) that represent two perpendicular wave directions. Table 1
lists information of the selected scaled records and Figurel shows both
scaled and unscaled accelerations against time series for NOR (FP of
record sets).
The last record set is an unscaled record from PEER web application database [14]
to intrinsically satisfy the Eastern region seismic condition as much
as possible. The 1985 Nahanni (NAH) earthquake is suggested for a
typical event of an East Coast US earthquake [15].
Furthermore, it is worthwhile to mention that selecting and scaling a
different set of records for a group of structures are difficult,
because they have a varied range of first mode periods [16].
Thus, the NAH earthquake is not scaled with the spectral matching
method. To scale NAH record, the direct scale method is applied [17].
*: Results from PEER Ground Motion Database Search Criteria
**: Applied as direct linear scale factor (Maximum Scaled PGA)
Plastic hinge definition and allocation to models
For nonlinear study, the lumped plastic hinge model
and backbone curve is the selected method. Concentrated hinge models may
typically be suitable for simulating nonlinear response of columns and
beams in frame systems [18]. The FEMA 356 [1] procedure and acceptance criteria are applied, and the software has the ability to calculate and comply the FEMA356 criteria [19].
Flexural plastic hinge is allocated to the beams in their strong
directions. Flexural hinging of columns is assigned under the combined
effects of bending in both directions and their interaction with axial
loads. Shear failure is not explicitly included in the analysis models,
but it is incorporated through the selected hinge failure modes and
limitations per FEMA 356 [1] modeling parameters and acceptance criteria.
Hysteresis models for beams and columns
On RC columns, Elastic-Perfectly Plastic (Elasto plastic) hysteresis model is performed. Yavari et al. [20]
compared the result of the RC frame model by using shaking table test
and nonlinear analytical modeling. The tested RC moment frame consisted
of columns, which were designed only for gravity loads. The acquired
results by Yavari et al. [20] showed good compliance between the test and analytical models for Elasto plastic hysteresis model. Pivot hysteresis model [21]
is used for the beams' hysteresis model. The experimental observations
of RC members under cyclic or dynamic loads determine that majority of
unloading paths are conducted toward a single point in a typical
force-displacement (or moment-rotation) plane (Figure 2).
This focal point is called the Pivot point [Ibid.]. To model LRC
components, the Pivot model has several analytical advantages, namely
pinching effect, degradation, hysteretic behavior verification through
experimental observations, applicable to model unsymmetrical sections,
and simplicity.

Damping model development
In the THA method, cyclic response of the plastic
hinge is the framework of hysteresis damping. However, it is possible to
induce some levels of artificial viscous damping forces in plastic
hinges [22].
Consequently, overestimation of the damping ratio may cause errors in
the calculation of the maximum nonlinear displacement of structures with
intermediate to long period range. Oppositely, underestimation of the
damping may lead to overestimate of displacements for shorter period
ranges, specifically for less than 0.4 seconds [23].
On the other hand, by reviewing the result of the study by Dwairi et
al. [Ibid.], it appears that the low ductile structures (such as LRC)
show lower scatter in damping amount comparable with the higher ductile
structural models.
In this regard, to calculate the viscous damping ratio, a simple equation is recommended by the PEER/ATC joint venture program [12].
This equation (Eqn. 1) is suitable for low to midrise buildings with
less than 30 stories in which the maximum percent of critical damping
(ξ) is defined as [Ibid.]:
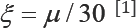
In Eqn. 1, n is a coefficient between 60 and 120 so
that RC structures would likely be closer to the upper bound of |i
coefficient [12]
between 90 and 120. A reasonable damping ratio forn coefficient is
assumed equal to arithmetic average of those limits, i.e. 105.
Consequently, the damping ratio per Eqn. 1 would be equal to 3.5%.Using
this method, all B and S archetype models are assumed to have critical
damping ratio. For LRC structures with asymmetric plan, experimental
results show that critical damping would be a reasonable estimate [24].
Thus, to acquire a suitable damping ratio for a LRC irregular plan
structure located in low- to moderate- seismic zones, 2% damping ratio
is applied which covers 2A12 through 8A18 models.
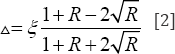
Hall [2006]
developed a procedure to calculate linear viscous damping factors and
this procedure is followed here. A in Eqn.2 determines bounds on the
damping ratios within the specific frequency range, and R denotes the
ratio of natural frequencies of the important modes [Ibid.].
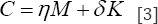
A classical viscous damping matrix, C, comprises of mass matrix, M, and stiffness matrix, K (Eqn.3):
Hall [22]
suggests that when the bound factor, i.e. A, is considerably low
(relative to £], then n and Scan be calculated from the following
equations:
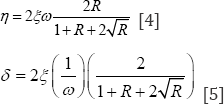
In Eqns.4 and 5, w indicates the first mode of
vibration (rad/s); other terms have been defined previously. The
computed factors would be performed to each associated model for
nonlinear time history analysis in accordance with the software input
requirements [11].
Applied dynamic analysis method
Each pair of scaled records consists of two separate
load cases, FP and FN, which are applied for every single selected
model. Thus, for each symmetric plan model, i.e. 2B12 to 8S18, total
eight (4 x 2) different THA cases have been performed. For the irregular
plan models, 2A12 to 8A18, the models are asymmetric in the North-South
direction. Hence, an extra case of FP negative direction for each "A"
model is performed to address this case.
The New mark method is the first choice of dynamic
equation solver in this study. In case of instability and numerical
issues, Hilber-Hughes-Taylor (HHT) is applied [19].
In the current study, for any THA case, which shows poor convergence,
the new mark integration method has been shifted to the HHT procedure.
Analytical Result Review
Maximum Drift
In general, maximum (max.) drift may not only lead to
structural damages, but also cause several problems interrelated to the
serviceability of buildings, such as breakage of pipes and utility
lines. Table 2
shows the maximum absolute drift (di) for the selected models which
area acquired from the analysis results. Structural performance levels
and damage criteria for vertical elements are presented in table C1-3 of
FEMA 356 [1].
This table for concrete frames states that the maximum acceptable drift
for Collapse Prevention (CP) is 4%, Life Safety (LS) 2%, and 1% is the
acceptable range for Immediate Occupancy (IO). The absolute value of
drift in the geometrical center of every story level (master
point/joint) is attained. The two-, four-, and eight- story models are
categorized into groups 1, 2, and 3, respectively. Two separate
directions are presented for each group. Basically, the presented drift
value associates with the maximum drift response among the four applied
records for each model.

Expectedly, the maximum absolute drift for each
direction is associated with the same direction of applied seismic
records. From Table 2,
the maximum amount of di is observed for 2A12 and 2A15 models in the
N-S direction. 4S18 model has the most vulnerable condition in both N-S
and E-W directions. However, the eight story models show overall less di
in comparison with the other groups. In the E-W direction, di of group 2
and group 3 is mostly concentrated at the higher story levels while in
the N-S direction the trend is reversed. For group 1, increase in the
first story height shows low effect on di of regular plan models. For A
type models of this group, the increase of the first story height may
even lead to the reduction of di. For group 2, A type models are
unaffected by the first story height alteration, but the first story
height increment is induced higher value of di in the symmetric plan
models. For the latter models, the maximum di is almost concentrated on
the first story as well. Review of group 3 results reveals that there is
no specific pattern for both asymmetric and symmetric plan models of
this group.
Table 2 indicates that none of the models exceed FEMA 356 [1] LS performance criterion, although number of models, which suffers over IO drift damage level, is considerable. Table 2
also shows that there is no substantial difference between asymmetric
plan and symmetric plan models in term of di. Moreover, it illustrates
that eight (8) story models suffer less severe drift and their maximum
drifts remain mostly within IO damage level. Numbers of upper and lower
bounds of maximum drifts for both groups 1 and 2 with no difference
between plan types are very similar and almost identical. For these
groups, per FEMA 356 [1] drift criteria, each of these models under the applied records may encounter higher than IO level of damage.
Average drift
Although the maximum absolute drift may at least be
attributed to LRC deficits, the proportionate drift change of all
stories cannot be reflected properly. To compare and review the drift
response of all selected models, the maximum drift result of each story
level is acquired. In agreement with the selected Cartesian system
(geometrical center of story level as the Cartesian center of the
system), the drift response is collected with negative sign and positive
sign for each direction of applied record. Then, the arithmetic mean of
results (i.e. average of maximum drift of each story level under all
applied records) for all seismic cases is calculated for negative and
positive directions. To do so, every story level two cases regarding FN
or FP component of the records (N-S or E-W) is computed independently.
These results are illustrated in Figure 3-8.
To study the effect of first story height on drift response, each
figure comprises results for asymmetric or symmetric plan models. Both
directions of seismic excitation (E-W or N-S) are depicted in
independent diagrams. Average drift in both directions of oscillation
(negative or positive) includes the horizontal axis and the story level
shows the vertical axis of the diagrams.

Overall, responses in figures 3 to8 are compatible with their effect on the drift response in comparison with the structural associated di in table 2.
In other words, the inherent and specific dynamics behavior of the
models. characteristics of the applied earthquakes may have lesser


Figure 7 & 8
reveal that the average drift responses of eight story models are less
than the other models. Regardless of the first story height, the N-S
direction of asymmetric plan models show more average first story drift
compared to the E-W direction. Lack of central columns in the first
story at axis B (Frames 1 to 3, see Rezavandi and Fu) [6]
is the most probable reason for this behavior. Archetype models 2A12
and 2A15 in the N-S direction suffer more than 1% average drift. Over IO
drift level criterion is occurred only in the N-S direction at the
first story level of the abovementioned models. Owing primarily to the
higher level of hinge formations [Ibid.], these models suffer more
lateral deformation. None of the other selected models goes beyond the
FEMA 356 [1] IO damage level although results show light sparse.
Four (4) story asymmetric plan models have the same
column section for their first story level. This is also the case for
the eight (8) story asymmetric plan models, which are obtained through
the traditional linear static analysis and design approach. Average
drift response of the first story of these models shows a typical
sequence. It means by increasing of the first story height for each
group of models with taller first stories induces more drift value. As
mentioned, the column sections are the same, and the previous sequence
is occurred for both E-W and N-S directions. Thus, these can only be
explained by considering soft story possibility, although in this case
the acquired drift is far less than story mechanism level. Furthermore,
difference between the E-W responses for all of these models is less in
contrast with the N-S direction (Figure 5 & 7).
This shows the effect of central column elimination on the average
drift response. For the aforementioned models, the response of upper
stories do not show any specific trend and more drift is observed for
all those models in upper stories than the first story. Due to the facts
that the input excitations (the applied THAs) for all of these cases
are the same, [25]
material and structural sections for all of the abovementioned models
are similar (despite the inherent similar dynamic analysis approach)
this complex phenomena in upper levels may only be associated with the
irregular shape of these models.
The previous trend is attributed to symmetric plan
models; i.e. models with taller first story, namely with 4.57m (15 feet)
or 5.49m(18 feet) first story height, show more first story drift.
However, the first story column section is not similar for this group of
models. In fact, 4S15 and 4S18 models have similar first story column
section while model 4B12 has a smaller section. Additionally, models
8B12 and 8S15 have similar first story section while the column section
of model 8S18 is different in this case. Similarity of the first story
average drift between the symmetric and asymmetric plan models shows
that the vertical irregularity may involve more in the erratic upper
stories response than the plan irregularity. In agreement with the above
statement, Figure 6
is addressed. In this figure, which is for group 2 models with
symmetric plan, both principal directions of model 4S18 response depict
more drift concentration on the first story. This case is a classical
condition of susceptible soft story response. 4B12 model is more regular
while 4S15 model behaves between 4S18 and 4B12 models with bias toward
4B12 drift response than 4S18. Though the vertical irregularity effect
in particular and overall drifts response in general is less dominant
for the eight story models, this is also the case for eight story models
with regular plan (Figure 8).
Figure 3-8
are categorized based on the similarity in both of the number of
stories and the first story plan type. To get a better view from the
preceding results and to review the effect of number of stories on the
response, the same average drift results are presented according to
story height similarity. In this case, figures 9
to 11 are provided to show the average drift for models with the first
story heights equal to 3.66 m, 4.57 m, and 5.49 m (12, 15, and 18 feet),
respectively. These figures may also be used to compare the plan
irregularity effect on the response of the models.


Unequivocally, the same result regarding lesser
average drift for eight story models in comparison with four story
models is observable in the following figures. The same trend is clear
for the comparison of four story models with the two story models.
Review of eight story models response shows their
response is attributed to the elastic stiffness. In addition, the
archetype models are originally designed for dead and live load effects.
The structural members for A type models are heavier than the symmetric
plan models, specifically in the first two stories. The stiffer lower
story levels of model 8A12 in the E-W direction (Figure 9,
top) have less average drift in comparison with the 8B12 model in its
lower stories. Their response gets closer in the upper stories.
8A18 model also has less average drift at its first
story than 8S18 while the difference between 8A18 and 8S18 becomes
mostly closer in lower levels. Again, the possible soft story phenomenon
may be prominent in this case. Models with 5.49m (18 feet) first story
height illustrate higher level of erratic response than 4.57m (15 feet)
first story height models.
For the abovementioned models, responses of models 8A18 to 8S18 are very close for the positive part of the N-S direction (Figure 10, bottom). It is the case for models 8A15 and 8S15 in Figure 11
(bottom). The possible reason for this behavior is the presence of
strong frame in axis 4 of asymmetric plan models, which help to absorb
the seismic energy (movement) elastically. In the negative direction of
applied seismic, less stiff part of the frame system (lack of middle
column line) leads to increase in the overall responses of models 8A18
and 8A15 in contrast with the 8S18 and 8S15 models. The difference
between average drift for models 8A12 and 8B12 becomes much less in the
negative part of N-S direction. It means the weak part of stiffness
irregularity (in plan) causes more drift in its side (which may be
achievable in elastic analysis as well), but the elevation irregularity
can exacerbate the drift response considerably.
To do the same analogy, overall responses in the E-W
and N-S directions of four (4) story models are very similar to the
former responses of eight story models. In this case, the difference
between responses is sharper than for eight story models. Almost all
asymmetric four story models have less drift in their first story than
the symmetric plan models. The results get closer or reverse for higher
levels. The lower columns and beams in asymmetric four story models are
stronger than corresponding symmetric models. All four story selected
models have similar column section at levels above the first level.
Thus, the response becomes closer toward upper levels. The effect of
first story height does not illustrate any specific trend for this group
of models.
Two story models have more drift while their response is more sporadic in comparison with other models. (Figure 9 & 11) show that 2A12 and 2A15 models have more or at least very close average drift corresponding to their symmetric plan models.
Conclusion
Except for few models, the eight story models show
less maximum absolute drift in comparison with the other models. THA
analysis shows that the maximum absolute drift for all eight story
models are within IO damage level per FEMA 356 [1]
criteria. Four and two story models may suffer more drift, although
their maximum drifts do not reach LS level. For the latter models, low
intense seismic event may impose noticeable damage state in LRC
structures. Regardless of symmetric or asymmetric plan configuration,
the maximum absolute drift is independent to the input records for two
and four story models, versus eight story models in which input record
is the dominant parameter for the acquired maximum absolute drift.
The maximum absolute drifts for both plan and/or
vertical irregular structures of this study do not show considerable
difference. This result is in disagreement with most design code
interpretations and assumptions regarding higher expected drift value
for a structure with both plan and height irregularities. Maximum
average drift reveals that the structural dynamic behavior may affect
response more than the inherent characteristics of applied ground
motions.
Lack of the first story middle row column for
asymmetric plan model causes more drift in the N-S directions comparing
to the E-W direction of the same models. Irregularities of the models
affect the models' drift response in their higher story levels. Models
with more irregularities (i.e. both plan and vertical irregularities)
illustrate more erratic drift response in their upper levels than models
with one irregular condition. The structural member size in lower
stories has considerable effect in the maximum average drift response in
the lower stories. For asymmetric plan models, the direction of
excitation (in the N-S axis) affects the maximum average drift response.
Increase of the first story height shows negligible
and even reverse effect to the maximum absolute drift for most
asymmetric plan models. Similar to symmetric plan models, the maximum
average drift values for eight and four story models are increased
through increment of the first story height. Additionally, similar to
the previous conclusion, the same possible soft story influence on the
maximum average response is recognizable for these cases as well.
While, there is a general agreement on hazardous
effect of plan irregularity corresponding to drift response in high
seismic zones, (Figure 3-11)
show that there might be considerable disagreement in this case
regarding selected models of this study. These figures illustrate that
the taller models suffer less drift, and asymmetric plan in the first
story does not change the overall response significantly. Indeed, for
several conditions, the plan irregular models illustrate lower amount
for average drift. However, consequence of the first story height still
affects the drift response of the selected models.
Within maximum drift results and outcomes of the
selected models, it is clear that low intense seismic events may create a
degree of noticeable damages in LRC structures. The damage level is
more for low-rise structures in comparison with the taller models. Per
seismic design regulations in most building codes, e.g. ASCE 7-10 [7],
it is expected to see higher damage level for asymmetric plan
structures. The unsymmetrical plan models indicate almost similar drift
performance in comparison with the symmetrical plan models regarding
maximum drift criterion.
Within the framework of this study, design of
structural members per early edition of design codes, without any
seismic consideration, seems to be sufficient to withstand the applied
ground motions regarding drift requirements. Failures do not seem to
occur for structural members with vertical irregularities, while extreme
vertical irregularity is applied for selection of the first story
height. It seems like that the more strict requirements of ASCE 7-10 [7]
with regard to vertical irregularities are mostly applicable for high
seismic zones. However, damage due to drift can be dominant for an
irregular structure in a low seismic zone, as the damage level is not
ignorable as shown before.
The current study shows that more attention may be
required by the authorities and professional societies to the drift
effect. While low seismic zone is a colloquial term, that does not mean a
zero damage. Indeed, lack of enough records and ignorance of seismic
design requirements in the existing LRC buildings, in low to moderate
seismic zones, can end up to an unexpected damage level during a seismic
event.
For More Open Access Journals Please Click on: Juniper Publishers
Fore More Articles Please Visit: Civil Engineering Research Journal


Comments
Post a Comment